Crow vs New Zealander Currently Married
COMPARE
Crow
New Zealander
Currently Married
Currently Married Comparison
Crow
New Zealanders
40.4%
CURRENTLY MARRIED
0.0/ 100
METRIC RATING
329th/ 347
METRIC RANK
47.4%
CURRENTLY MARRIED
84.9/ 100
METRIC RATING
127th/ 347
METRIC RANK
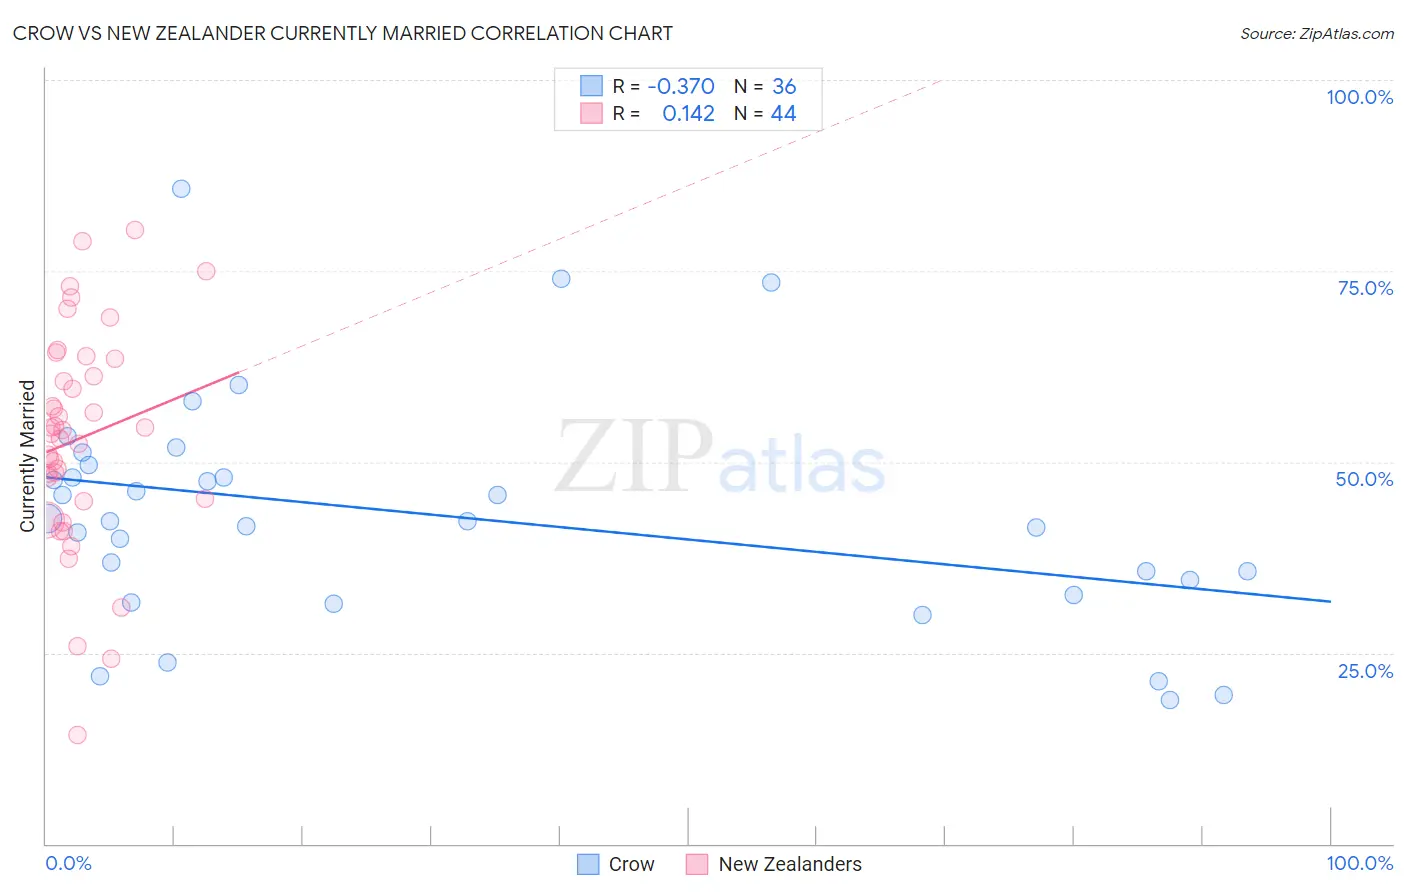
Crow vs New Zealander Currently Married Correlation Chart
The statistical analysis conducted on geographies consisting of 59,208,662 people shows a mild negative correlation between the proportion of Crow and percentage of population currently married in the United States with a correlation coefficient (R) of -0.370 and weighted average of 40.4%. Similarly, the statistical analysis conducted on geographies consisting of 106,918,657 people shows a poor positive correlation between the proportion of New Zealanders and percentage of population currently married in the United States with a correlation coefficient (R) of 0.142 and weighted average of 47.4%, a difference of 17.3%.
Currently Married Correlation Summary
| Measurement | Crow | New Zealander |
| Minimum | 18.8% | 14.3% |
| Maximum | 85.8% | 80.4% |
| Range | 67.0% | 66.1% |
| Mean | 43.0% | 53.0% |
| Median | 42.2% | 53.9% |
| Interquartile 25% (IQ1) | 33.5% | 45.0% |
| Interquartile 75% (IQ3) | 48.8% | 62.4% |
| Interquartile Range (IQR) | 15.3% | 17.4% |
| Standard Deviation (Sample) | 15.0% | 14.2% |
| Standard Deviation (Population) | 14.8% | 14.0% |
Similar Demographics by Currently Married
Demographics Similar to Crow by Currently Married
In terms of currently married, the demographic groups most similar to Crow are Immigrants from Dominica (40.3%, a difference of 0.090%), Immigrants from Barbados (40.3%, a difference of 0.10%), Arapaho (40.5%, a difference of 0.43%), Senegalese (40.6%, a difference of 0.47%), and Barbadian (40.6%, a difference of 0.65%).
| Demographics | Rating | Rank | Currently Married |
| Immigrants | Haiti | 0.0 /100 | #322 | Tragic 41.0% |
| Immigrants | West Indies | 0.0 /100 | #323 | Tragic 40.7% |
| Immigrants | Senegal | 0.0 /100 | #324 | Tragic 40.7% |
| U.S. Virgin Islanders | 0.0 /100 | #325 | Tragic 40.7% |
| Barbadians | 0.0 /100 | #326 | Tragic 40.6% |
| Senegalese | 0.0 /100 | #327 | Tragic 40.6% |
| Arapaho | 0.0 /100 | #328 | Tragic 40.5% |
| Crow | 0.0 /100 | #329 | Tragic 40.4% |
| Immigrants | Dominica | 0.0 /100 | #330 | Tragic 40.3% |
| Immigrants | Barbados | 0.0 /100 | #331 | Tragic 40.3% |
| Immigrants | St. Vincent and the Grenadines | 0.0 /100 | #332 | Tragic 40.1% |
| Yup'ik | 0.0 /100 | #333 | Tragic 39.9% |
| Puerto Ricans | 0.0 /100 | #334 | Tragic 39.9% |
| Lumbee | 0.0 /100 | #335 | Tragic 39.8% |
| British West Indians | 0.0 /100 | #336 | Tragic 39.8% |
Demographics Similar to New Zealanders by Currently Married
In terms of currently married, the demographic groups most similar to New Zealanders are Immigrants from Jordan (47.4%, a difference of 0.0%), Okinawan (47.4%, a difference of 0.030%), Portuguese (47.3%, a difference of 0.040%), Sri Lankan (47.3%, a difference of 0.11%), and Laotian (47.4%, a difference of 0.13%).
| Demographics | Rating | Rank | Currently Married |
| Syrians | 88.9 /100 | #120 | Excellent 47.5% |
| Immigrants | Croatia | 88.6 /100 | #121 | Excellent 47.5% |
| Osage | 87.9 /100 | #122 | Excellent 47.5% |
| Immigrants | Kazakhstan | 87.2 /100 | #123 | Excellent 47.4% |
| Laotians | 86.6 /100 | #124 | Excellent 47.4% |
| Okinawans | 85.3 /100 | #125 | Excellent 47.4% |
| Immigrants | Jordan | 84.9 /100 | #126 | Excellent 47.4% |
| New Zealanders | 84.9 /100 | #127 | Excellent 47.4% |
| Portuguese | 84.2 /100 | #128 | Excellent 47.3% |
| Sri Lankans | 83.2 /100 | #129 | Excellent 47.3% |
| Immigrants | Iraq | 82.8 /100 | #130 | Excellent 47.3% |
| Icelanders | 82.4 /100 | #131 | Excellent 47.3% |
| Afghans | 81.8 /100 | #132 | Excellent 47.3% |
| Immigrants | Malaysia | 81.1 /100 | #133 | Excellent 47.3% |
| Immigrants | Australia | 81.1 /100 | #134 | Excellent 47.3% |