Crow vs Soviet Union Currently Married
COMPARE
Crow
Soviet Union
Currently Married
Currently Married Comparison
Crow
Soviet Union
40.4%
CURRENTLY MARRIED
0.0/ 100
METRIC RATING
329th/ 347
METRIC RANK
46.2%
CURRENTLY MARRIED
25.7/ 100
METRIC RATING
192nd/ 347
METRIC RANK
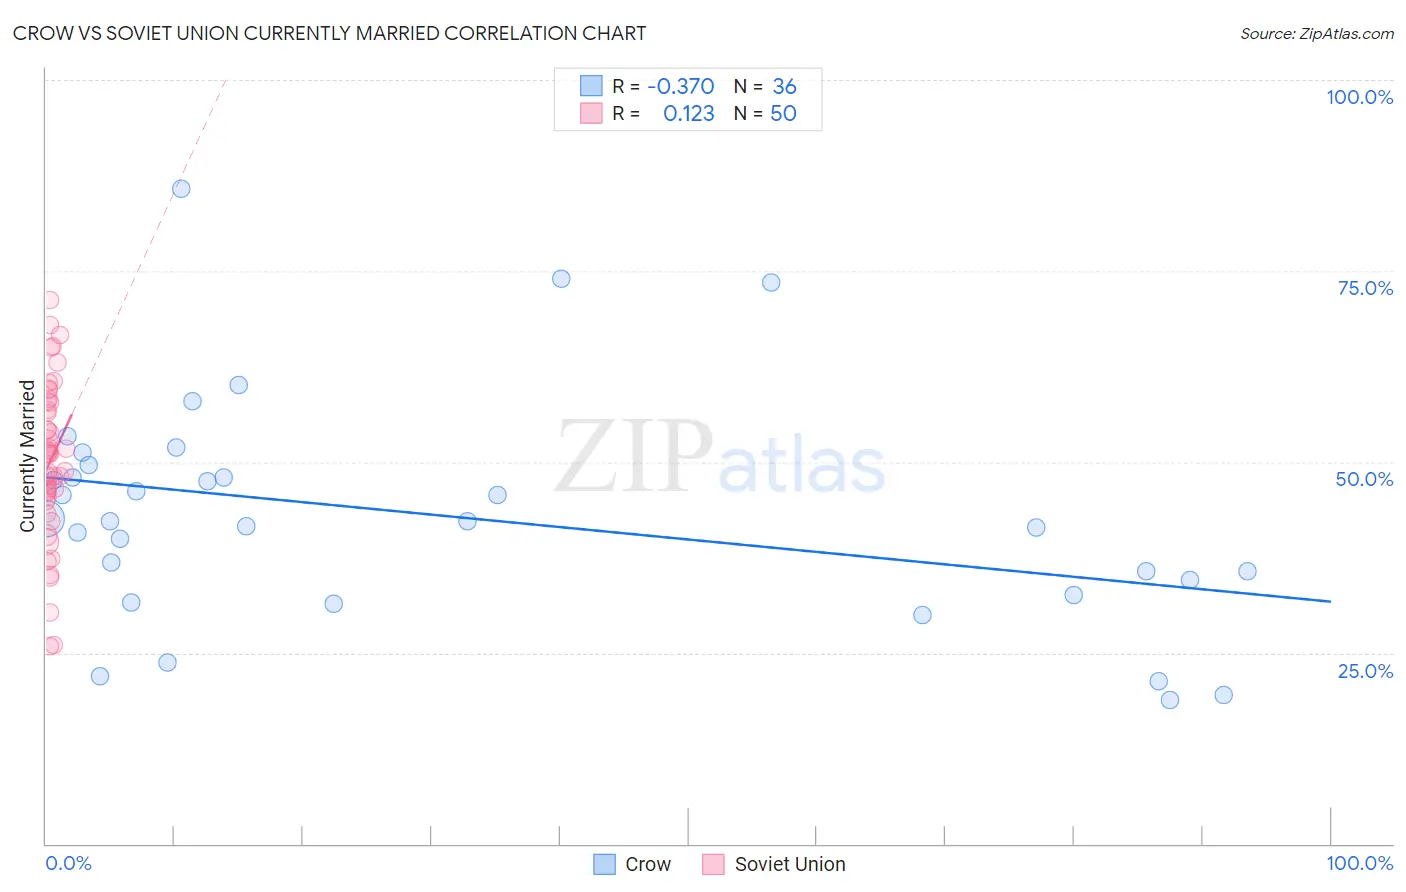
Crow vs Soviet Union Currently Married Correlation Chart
The statistical analysis conducted on geographies consisting of 59,208,662 people shows a mild negative correlation between the proportion of Crow and percentage of population currently married in the United States with a correlation coefficient (R) of -0.370 and weighted average of 40.4%. Similarly, the statistical analysis conducted on geographies consisting of 43,514,626 people shows a poor positive correlation between the proportion of Soviet Union and percentage of population currently married in the United States with a correlation coefficient (R) of 0.123 and weighted average of 46.2%, a difference of 14.4%.
Currently Married Correlation Summary
| Measurement | Crow | Soviet Union |
| Minimum | 18.8% | 25.9% |
| Maximum | 85.8% | 71.3% |
| Range | 67.0% | 45.4% |
| Mean | 43.0% | 50.1% |
| Median | 42.2% | 51.1% |
| Interquartile 25% (IQ1) | 33.5% | 45.4% |
| Interquartile 75% (IQ3) | 48.8% | 57.7% |
| Interquartile Range (IQR) | 15.3% | 12.3% |
| Standard Deviation (Sample) | 15.0% | 10.3% |
| Standard Deviation (Population) | 14.8% | 10.2% |
Similar Demographics by Currently Married
Demographics Similar to Crow by Currently Married
In terms of currently married, the demographic groups most similar to Crow are Immigrants from Dominica (40.3%, a difference of 0.090%), Immigrants from Barbados (40.3%, a difference of 0.10%), Arapaho (40.5%, a difference of 0.43%), Senegalese (40.6%, a difference of 0.47%), and Barbadian (40.6%, a difference of 0.65%).
| Demographics | Rating | Rank | Currently Married |
| Immigrants | Haiti | 0.0 /100 | #322 | Tragic 41.0% |
| Immigrants | West Indies | 0.0 /100 | #323 | Tragic 40.7% |
| Immigrants | Senegal | 0.0 /100 | #324 | Tragic 40.7% |
| U.S. Virgin Islanders | 0.0 /100 | #325 | Tragic 40.7% |
| Barbadians | 0.0 /100 | #326 | Tragic 40.6% |
| Senegalese | 0.0 /100 | #327 | Tragic 40.6% |
| Arapaho | 0.0 /100 | #328 | Tragic 40.5% |
| Crow | 0.0 /100 | #329 | Tragic 40.4% |
| Immigrants | Dominica | 0.0 /100 | #330 | Tragic 40.3% |
| Immigrants | Barbados | 0.0 /100 | #331 | Tragic 40.3% |
| Immigrants | St. Vincent and the Grenadines | 0.0 /100 | #332 | Tragic 40.1% |
| Yup'ik | 0.0 /100 | #333 | Tragic 39.9% |
| Puerto Ricans | 0.0 /100 | #334 | Tragic 39.9% |
| Lumbee | 0.0 /100 | #335 | Tragic 39.8% |
| British West Indians | 0.0 /100 | #336 | Tragic 39.8% |
Demographics Similar to Soviet Union by Currently Married
In terms of currently married, the demographic groups most similar to Soviet Union are Immigrants from Fiji (46.2%, a difference of 0.040%), Immigrants from France (46.2%, a difference of 0.090%), South American (46.1%, a difference of 0.10%), Immigrants from Nepal (46.1%, a difference of 0.10%), and Choctaw (46.3%, a difference of 0.16%).
| Demographics | Rating | Rank | Currently Married |
| Mongolians | 37.6 /100 | #185 | Fair 46.4% |
| Immigrants | Chile | 36.8 /100 | #186 | Fair 46.4% |
| Immigrants | Peru | 35.3 /100 | #187 | Fair 46.4% |
| Colombians | 31.8 /100 | #188 | Fair 46.3% |
| Fijians | 30.3 /100 | #189 | Fair 46.3% |
| Choctaw | 29.1 /100 | #190 | Fair 46.3% |
| Immigrants | France | 27.7 /100 | #191 | Fair 46.2% |
| Soviet Union | 25.7 /100 | #192 | Fair 46.2% |
| Immigrants | Fiji | 25.0 /100 | #193 | Fair 46.2% |
| South Americans | 23.8 /100 | #194 | Fair 46.1% |
| Immigrants | Nepal | 23.7 /100 | #195 | Fair 46.1% |
| Immigrants | Bosnia and Herzegovina | 22.2 /100 | #196 | Fair 46.1% |
| Immigrants | Kuwait | 21.7 /100 | #197 | Fair 46.1% |
| Immigrants | Colombia | 21.0 /100 | #198 | Fair 46.1% |
| Immigrants | Costa Rica | 19.6 /100 | #199 | Poor 46.0% |