Crow vs Swiss Currently Married
COMPARE
Crow
Swiss
Currently Married
Currently Married Comparison
Crow
Swiss
40.4%
CURRENTLY MARRIED
0.0/ 100
METRIC RATING
329th/ 347
METRIC RANK
49.7%
CURRENTLY MARRIED
99.9/ 100
METRIC RATING
12th/ 347
METRIC RANK
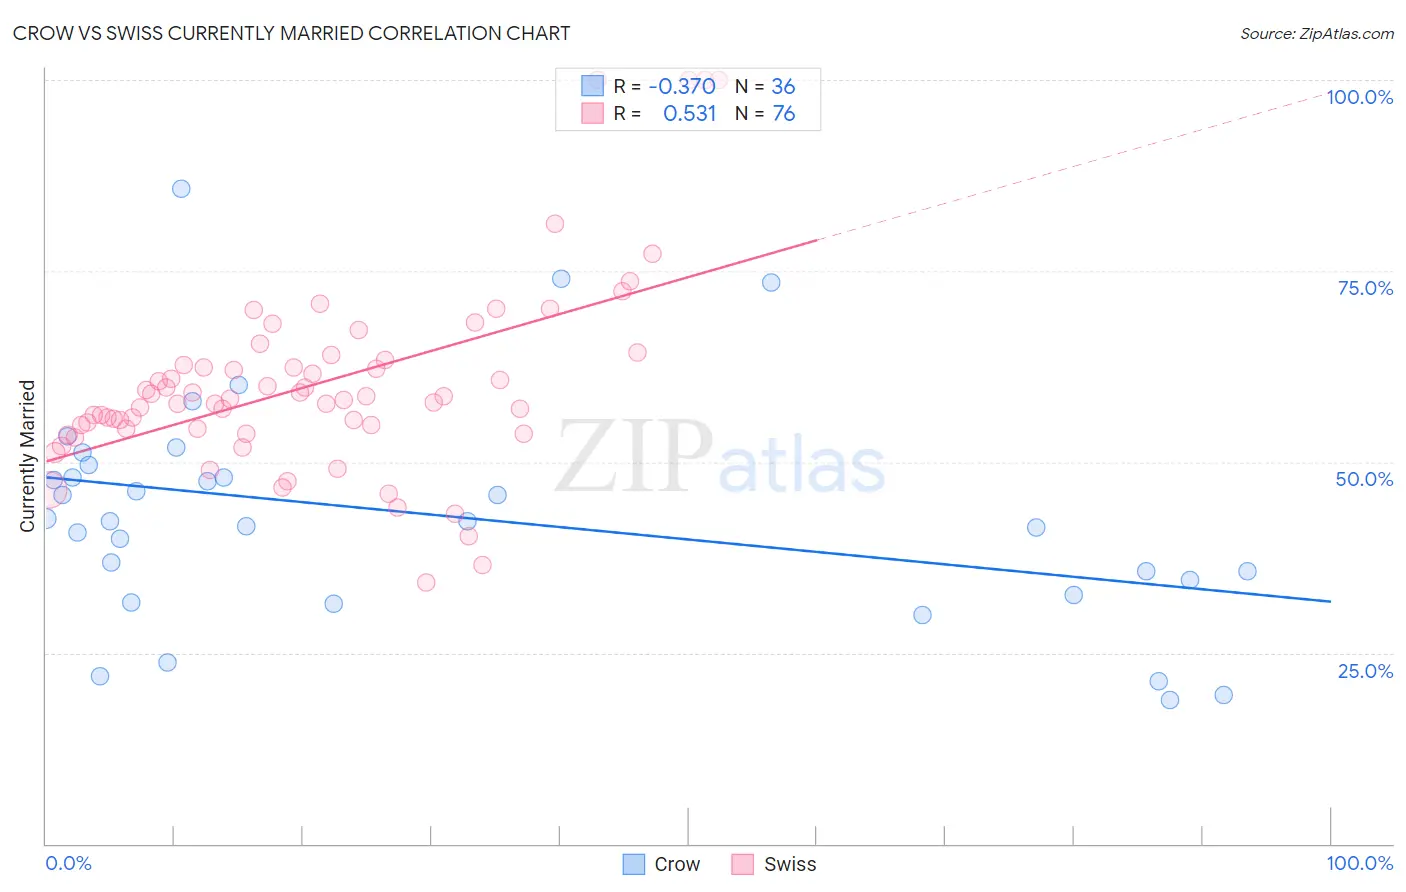
Crow vs Swiss Currently Married Correlation Chart
The statistical analysis conducted on geographies consisting of 59,208,662 people shows a mild negative correlation between the proportion of Crow and percentage of population currently married in the United States with a correlation coefficient (R) of -0.370 and weighted average of 40.4%. Similarly, the statistical analysis conducted on geographies consisting of 464,962,808 people shows a substantial positive correlation between the proportion of Swiss and percentage of population currently married in the United States with a correlation coefficient (R) of 0.531 and weighted average of 49.7%, a difference of 23.2%.
Currently Married Correlation Summary
| Measurement | Crow | Swiss |
| Minimum | 18.8% | 34.3% |
| Maximum | 85.8% | 100.0% |
| Range | 67.0% | 65.7% |
| Mean | 43.0% | 60.1% |
| Median | 42.2% | 58.2% |
| Interquartile 25% (IQ1) | 33.5% | 54.3% |
| Interquartile 75% (IQ3) | 48.8% | 63.1% |
| Interquartile Range (IQR) | 15.3% | 8.8% |
| Standard Deviation (Sample) | 15.0% | 12.7% |
| Standard Deviation (Population) | 14.8% | 12.6% |
Similar Demographics by Currently Married
Demographics Similar to Crow by Currently Married
In terms of currently married, the demographic groups most similar to Crow are Immigrants from Dominica (40.3%, a difference of 0.090%), Immigrants from Barbados (40.3%, a difference of 0.10%), Arapaho (40.5%, a difference of 0.43%), Senegalese (40.6%, a difference of 0.47%), and Barbadian (40.6%, a difference of 0.65%).
| Demographics | Rating | Rank | Currently Married |
| Immigrants | Haiti | 0.0 /100 | #322 | Tragic 41.0% |
| Immigrants | West Indies | 0.0 /100 | #323 | Tragic 40.7% |
| Immigrants | Senegal | 0.0 /100 | #324 | Tragic 40.7% |
| U.S. Virgin Islanders | 0.0 /100 | #325 | Tragic 40.7% |
| Barbadians | 0.0 /100 | #326 | Tragic 40.6% |
| Senegalese | 0.0 /100 | #327 | Tragic 40.6% |
| Arapaho | 0.0 /100 | #328 | Tragic 40.5% |
| Crow | 0.0 /100 | #329 | Tragic 40.4% |
| Immigrants | Dominica | 0.0 /100 | #330 | Tragic 40.3% |
| Immigrants | Barbados | 0.0 /100 | #331 | Tragic 40.3% |
| Immigrants | St. Vincent and the Grenadines | 0.0 /100 | #332 | Tragic 40.1% |
| Yup'ik | 0.0 /100 | #333 | Tragic 39.9% |
| Puerto Ricans | 0.0 /100 | #334 | Tragic 39.9% |
| Lumbee | 0.0 /100 | #335 | Tragic 39.8% |
| British West Indians | 0.0 /100 | #336 | Tragic 39.8% |
Demographics Similar to Swiss by Currently Married
In terms of currently married, the demographic groups most similar to Swiss are English (49.7%, a difference of 0.0%), Filipino (49.7%, a difference of 0.020%), Dutch (49.6%, a difference of 0.26%), Czech (49.9%, a difference of 0.27%), and German (49.6%, a difference of 0.28%).
| Demographics | Rating | Rank | Currently Married |
| Danes | 100.0 /100 | #5 | Exceptional 50.5% |
| Norwegians | 100.0 /100 | #6 | Exceptional 50.2% |
| Immigrants | South Central Asia | 100.0 /100 | #7 | Exceptional 50.0% |
| Swedes | 100.0 /100 | #8 | Exceptional 50.0% |
| Czechs | 99.9 /100 | #9 | Exceptional 49.9% |
| Filipinos | 99.9 /100 | #10 | Exceptional 49.7% |
| English | 99.9 /100 | #11 | Exceptional 49.7% |
| Swiss | 99.9 /100 | #12 | Exceptional 49.7% |
| Dutch | 99.9 /100 | #13 | Exceptional 49.6% |
| Germans | 99.9 /100 | #14 | Exceptional 49.6% |
| Pennsylvania Germans | 99.9 /100 | #15 | Exceptional 49.6% |
| Chinese | 99.9 /100 | #16 | Exceptional 49.5% |
| Scandinavians | 99.9 /100 | #17 | Exceptional 49.5% |
| Immigrants | Scotland | 99.8 /100 | #18 | Exceptional 49.3% |
| Europeans | 99.8 /100 | #19 | Exceptional 49.3% |