Belizean vs Immigrants from Serbia Currently Married
COMPARE
Belizean
Immigrants from Serbia
Currently Married
Currently Married Comparison
Belizeans
Immigrants from Serbia
42.2%
CURRENTLY MARRIED
0.0/ 100
METRIC RATING
300th/ 347
METRIC RANK
47.0%
CURRENTLY MARRIED
68.8/ 100
METRIC RATING
152nd/ 347
METRIC RANK
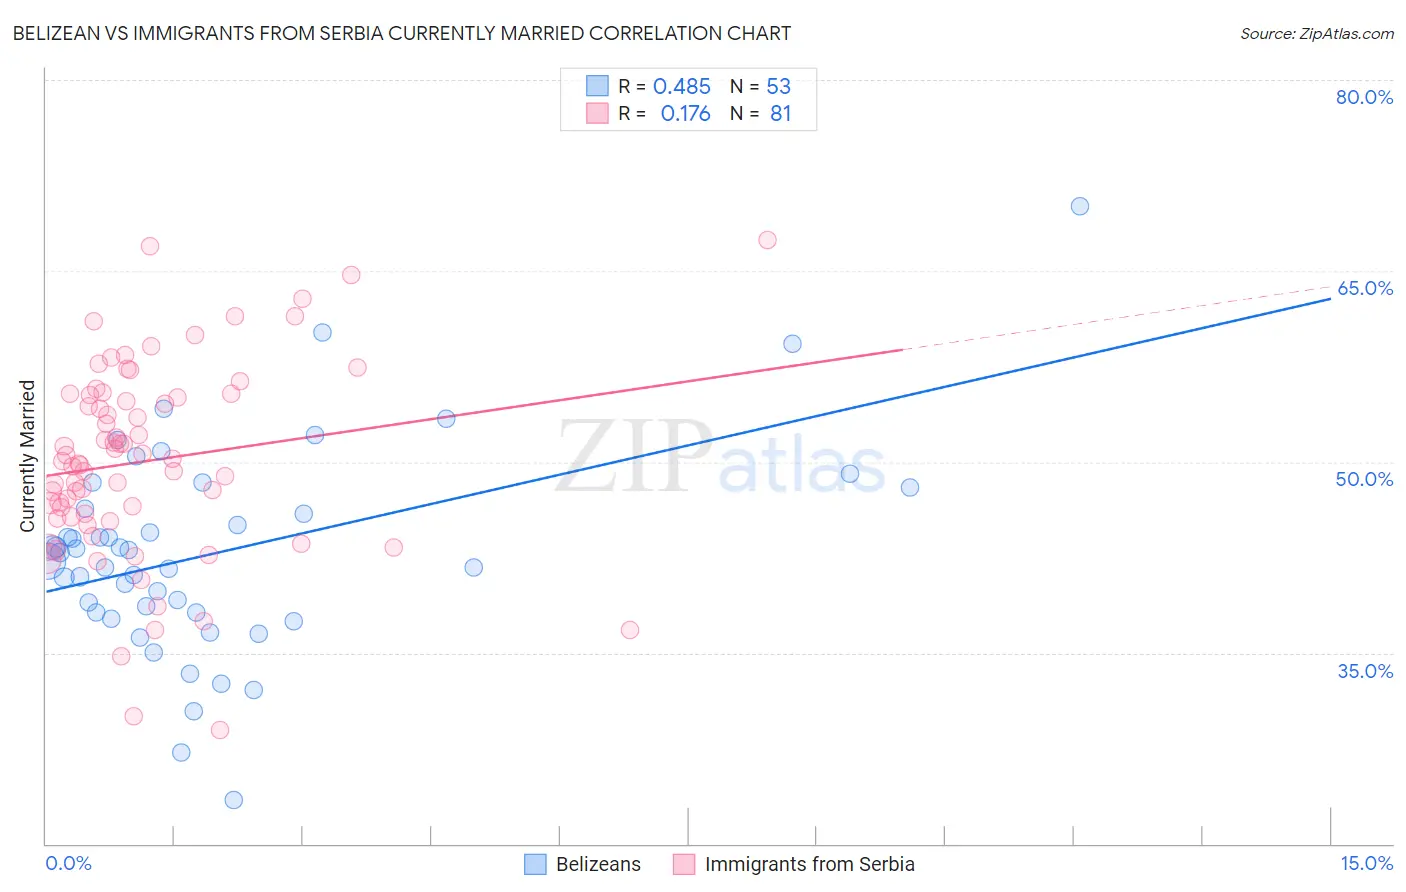
Belizean vs Immigrants from Serbia Currently Married Correlation Chart
The statistical analysis conducted on geographies consisting of 144,212,972 people shows a moderate positive correlation between the proportion of Belizeans and percentage of population currently married in the United States with a correlation coefficient (R) of 0.485 and weighted average of 42.2%. Similarly, the statistical analysis conducted on geographies consisting of 131,746,050 people shows a poor positive correlation between the proportion of Immigrants from Serbia and percentage of population currently married in the United States with a correlation coefficient (R) of 0.176 and weighted average of 47.0%, a difference of 11.4%.
Currently Married Correlation Summary
| Measurement | Belizean | Immigrants from Serbia |
| Minimum | 23.5% | 28.9% |
| Maximum | 70.1% | 67.4% |
| Range | 46.6% | 38.5% |
| Mean | 42.9% | 50.1% |
| Median | 42.8% | 50.1% |
| Interquartile 25% (IQ1) | 38.2% | 45.6% |
| Interquartile 75% (IQ3) | 47.1% | 55.3% |
| Interquartile Range (IQR) | 9.0% | 9.7% |
| Standard Deviation (Sample) | 8.1% | 7.6% |
| Standard Deviation (Population) | 8.1% | 7.6% |
Similar Demographics by Currently Married
Demographics Similar to Belizeans by Currently Married
In terms of currently married, the demographic groups most similar to Belizeans are Liberian (42.2%, a difference of 0.10%), Immigrants from Honduras (42.2%, a difference of 0.13%), Cheyenne (42.2%, a difference of 0.22%), Immigrants from Yemen (42.1%, a difference of 0.24%), and Menominee (42.3%, a difference of 0.33%).
| Demographics | Rating | Rank | Currently Married |
| Yuman | 0.0 /100 | #293 | Tragic 42.6% |
| Hondurans | 0.0 /100 | #294 | Tragic 42.5% |
| Immigrants | Western Africa | 0.0 /100 | #295 | Tragic 42.4% |
| Menominee | 0.0 /100 | #296 | Tragic 42.3% |
| Cheyenne | 0.0 /100 | #297 | Tragic 42.2% |
| Immigrants | Honduras | 0.0 /100 | #298 | Tragic 42.2% |
| Liberians | 0.0 /100 | #299 | Tragic 42.2% |
| Belizeans | 0.0 /100 | #300 | Tragic 42.2% |
| Immigrants | Yemen | 0.0 /100 | #301 | Tragic 42.1% |
| Immigrants | Zaire | 0.0 /100 | #302 | Tragic 42.0% |
| Sioux | 0.0 /100 | #303 | Tragic 41.9% |
| Immigrants | Bahamas | 0.0 /100 | #304 | Tragic 41.9% |
| Immigrants | Trinidad and Tobago | 0.0 /100 | #305 | Tragic 41.9% |
| Immigrants | Guyana | 0.0 /100 | #306 | Tragic 41.9% |
| Africans | 0.0 /100 | #307 | Tragic 41.8% |
Demographics Similar to Immigrants from Serbia by Currently Married
In terms of currently married, the demographic groups most similar to Immigrants from Serbia are Immigrants from Venezuela (47.0%, a difference of 0.010%), Albanian (47.0%, a difference of 0.010%), Arab (47.0%, a difference of 0.010%), Spanish (47.0%, a difference of 0.030%), and Chilean (47.0%, a difference of 0.040%).
| Demographics | Rating | Rank | Currently Married |
| Immigrants | South Eastern Asia | 72.9 /100 | #145 | Good 47.1% |
| Carpatho Rusyns | 72.6 /100 | #146 | Good 47.0% |
| Immigrants | Argentina | 72.0 /100 | #147 | Good 47.0% |
| Cambodians | 70.4 /100 | #148 | Good 47.0% |
| Zimbabweans | 70.1 /100 | #149 | Good 47.0% |
| Immigrants | Turkey | 70.0 /100 | #150 | Good 47.0% |
| Chileans | 69.8 /100 | #151 | Good 47.0% |
| Immigrants | Serbia | 68.8 /100 | #152 | Good 47.0% |
| Immigrants | Venezuela | 68.6 /100 | #153 | Good 47.0% |
| Albanians | 68.6 /100 | #154 | Good 47.0% |
| Arabs | 68.6 /100 | #155 | Good 47.0% |
| Spanish | 68.1 /100 | #156 | Good 47.0% |
| Immigrants | Switzerland | 67.8 /100 | #157 | Good 46.9% |
| Cherokee | 66.8 /100 | #158 | Good 46.9% |
| Iraqis | 66.4 /100 | #159 | Good 46.9% |