Immigrants from Cambodia vs Immigrants from Serbia Currently Married
COMPARE
Immigrants from Cambodia
Immigrants from Serbia
Currently Married
Currently Married Comparison
Immigrants from Cambodia
Immigrants from Serbia
44.5%
CURRENTLY MARRIED
0.7/ 100
METRIC RATING
242nd/ 347
METRIC RANK
47.0%
CURRENTLY MARRIED
68.8/ 100
METRIC RATING
152nd/ 347
METRIC RANK
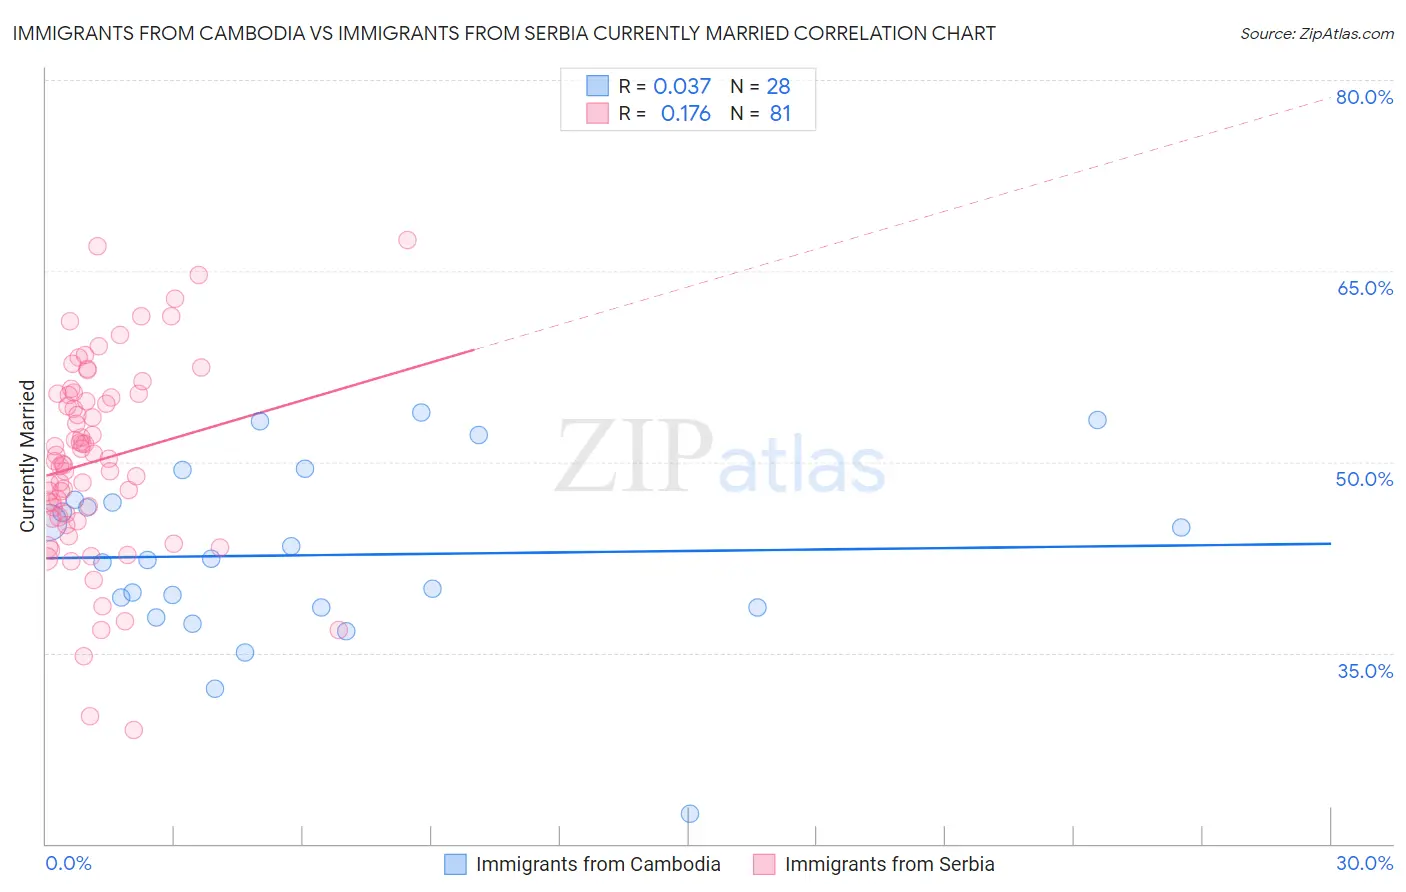
Immigrants from Cambodia vs Immigrants from Serbia Currently Married Correlation Chart
The statistical analysis conducted on geographies consisting of 205,155,379 people shows no correlation between the proportion of Immigrants from Cambodia and percentage of population currently married in the United States with a correlation coefficient (R) of 0.037 and weighted average of 44.5%. Similarly, the statistical analysis conducted on geographies consisting of 131,746,050 people shows a poor positive correlation between the proportion of Immigrants from Serbia and percentage of population currently married in the United States with a correlation coefficient (R) of 0.176 and weighted average of 47.0%, a difference of 5.5%.
Currently Married Correlation Summary
| Measurement | Immigrants from Cambodia | Immigrants from Serbia |
| Minimum | 22.4% | 28.9% |
| Maximum | 53.9% | 67.4% |
| Range | 31.5% | 38.5% |
| Mean | 42.7% | 50.1% |
| Median | 42.3% | 50.1% |
| Interquartile 25% (IQ1) | 38.6% | 45.6% |
| Interquartile 75% (IQ3) | 46.9% | 55.3% |
| Interquartile Range (IQR) | 8.3% | 9.7% |
| Standard Deviation (Sample) | 7.1% | 7.6% |
| Standard Deviation (Population) | 6.9% | 7.6% |
Similar Demographics by Currently Married
Demographics Similar to Immigrants from Cambodia by Currently Married
In terms of currently married, the demographic groups most similar to Immigrants from Cambodia are Immigrants from Ethiopia (44.5%, a difference of 0.010%), Ethiopian (44.5%, a difference of 0.030%), Immigrants from Mexico (44.5%, a difference of 0.090%), Mexican American Indian (44.5%, a difference of 0.090%), and Japanese (44.5%, a difference of 0.090%).
| Demographics | Rating | Rank | Currently Married |
| Alaskan Athabascans | 0.9 /100 | #235 | Tragic 44.6% |
| Cubans | 0.9 /100 | #236 | Tragic 44.6% |
| Seminole | 0.9 /100 | #237 | Tragic 44.6% |
| Moroccans | 0.9 /100 | #238 | Tragic 44.6% |
| Immigrants | Mexico | 0.7 /100 | #239 | Tragic 44.5% |
| Mexican American Indians | 0.7 /100 | #240 | Tragic 44.5% |
| Ethiopians | 0.7 /100 | #241 | Tragic 44.5% |
| Immigrants | Cambodia | 0.7 /100 | #242 | Tragic 44.5% |
| Immigrants | Ethiopia | 0.7 /100 | #243 | Tragic 44.5% |
| Japanese | 0.6 /100 | #244 | Tragic 44.5% |
| Immigrants | Armenia | 0.4 /100 | #245 | Tragic 44.3% |
| Immigrants | Burma/Myanmar | 0.4 /100 | #246 | Tragic 44.3% |
| Ugandans | 0.4 /100 | #247 | Tragic 44.2% |
| Nicaraguans | 0.3 /100 | #248 | Tragic 44.2% |
| Immigrants | Cameroon | 0.3 /100 | #249 | Tragic 44.2% |
Demographics Similar to Immigrants from Serbia by Currently Married
In terms of currently married, the demographic groups most similar to Immigrants from Serbia are Immigrants from Venezuela (47.0%, a difference of 0.010%), Albanian (47.0%, a difference of 0.010%), Arab (47.0%, a difference of 0.010%), Spanish (47.0%, a difference of 0.030%), and Chilean (47.0%, a difference of 0.040%).
| Demographics | Rating | Rank | Currently Married |
| Immigrants | South Eastern Asia | 72.9 /100 | #145 | Good 47.1% |
| Carpatho Rusyns | 72.6 /100 | #146 | Good 47.0% |
| Immigrants | Argentina | 72.0 /100 | #147 | Good 47.0% |
| Cambodians | 70.4 /100 | #148 | Good 47.0% |
| Zimbabweans | 70.1 /100 | #149 | Good 47.0% |
| Immigrants | Turkey | 70.0 /100 | #150 | Good 47.0% |
| Chileans | 69.8 /100 | #151 | Good 47.0% |
| Immigrants | Serbia | 68.8 /100 | #152 | Good 47.0% |
| Immigrants | Venezuela | 68.6 /100 | #153 | Good 47.0% |
| Albanians | 68.6 /100 | #154 | Good 47.0% |
| Arabs | 68.6 /100 | #155 | Good 47.0% |
| Spanish | 68.1 /100 | #156 | Good 47.0% |
| Immigrants | Switzerland | 67.8 /100 | #157 | Good 46.9% |
| Cherokee | 66.8 /100 | #158 | Good 46.9% |
| Iraqis | 66.4 /100 | #159 | Good 46.9% |