Crow vs Immigrants from Afghanistan Currently Married
COMPARE
Crow
Immigrants from Afghanistan
Currently Married
Currently Married Comparison
Crow
Immigrants from Afghanistan
40.4%
CURRENTLY MARRIED
0.0/ 100
METRIC RATING
329th/ 347
METRIC RANK
46.8%
CURRENTLY MARRIED
58.2/ 100
METRIC RATING
168th/ 347
METRIC RANK
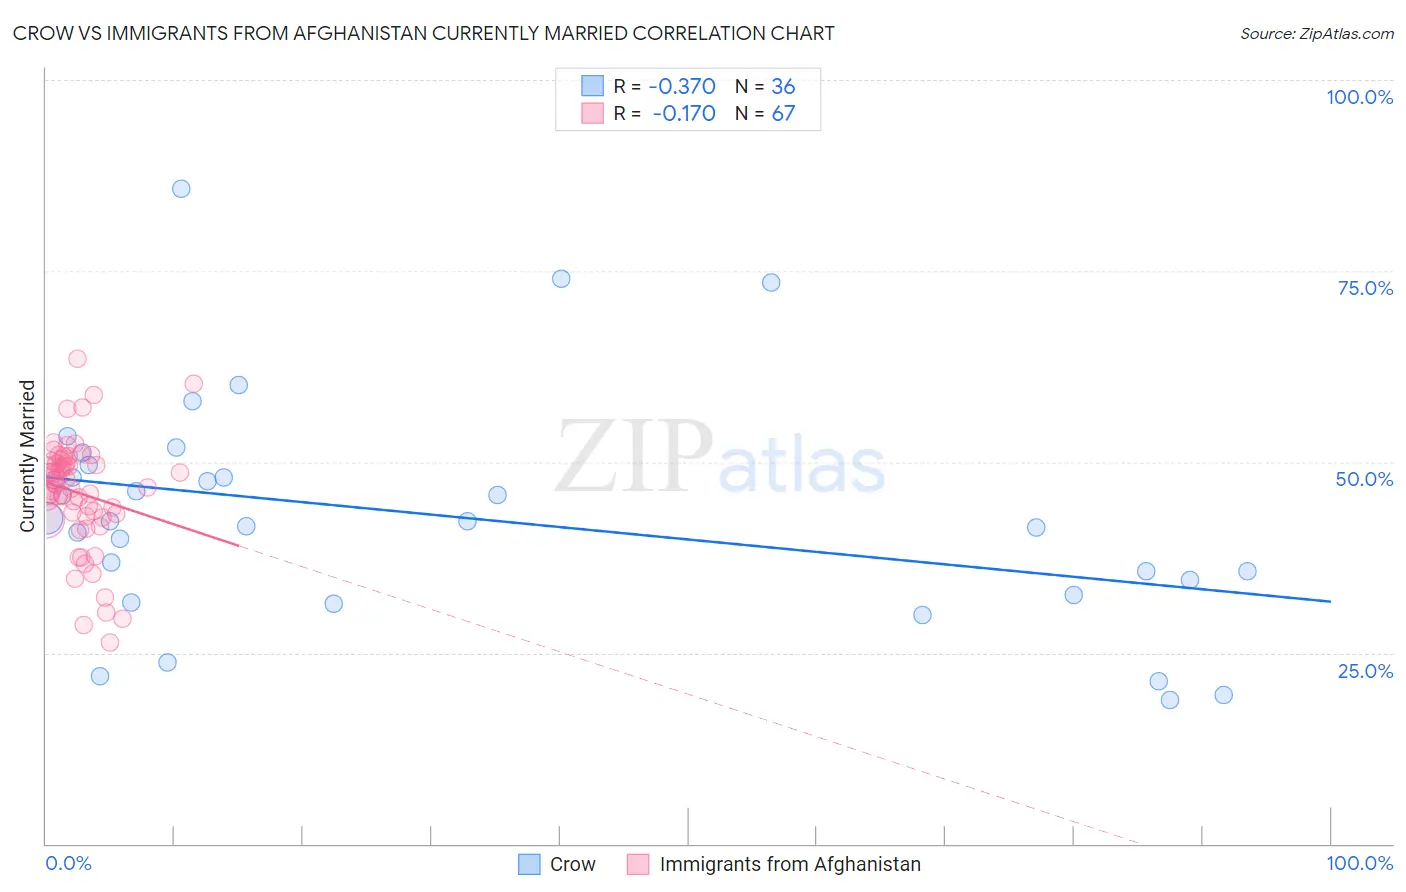
Crow vs Immigrants from Afghanistan Currently Married Correlation Chart
The statistical analysis conducted on geographies consisting of 59,208,662 people shows a mild negative correlation between the proportion of Crow and percentage of population currently married in the United States with a correlation coefficient (R) of -0.370 and weighted average of 40.4%. Similarly, the statistical analysis conducted on geographies consisting of 147,642,585 people shows a poor negative correlation between the proportion of Immigrants from Afghanistan and percentage of population currently married in the United States with a correlation coefficient (R) of -0.170 and weighted average of 46.8%, a difference of 15.9%.
Currently Married Correlation Summary
| Measurement | Crow | Immigrants from Afghanistan |
| Minimum | 18.8% | 26.3% |
| Maximum | 85.8% | 63.5% |
| Range | 67.0% | 37.2% |
| Mean | 43.0% | 46.0% |
| Median | 42.2% | 46.9% |
| Interquartile 25% (IQ1) | 33.5% | 42.8% |
| Interquartile 75% (IQ3) | 48.8% | 50.1% |
| Interquartile Range (IQR) | 15.3% | 7.3% |
| Standard Deviation (Sample) | 15.0% | 7.2% |
| Standard Deviation (Population) | 14.8% | 7.2% |
Similar Demographics by Currently Married
Demographics Similar to Crow by Currently Married
In terms of currently married, the demographic groups most similar to Crow are Immigrants from Dominica (40.3%, a difference of 0.090%), Immigrants from Barbados (40.3%, a difference of 0.10%), Arapaho (40.5%, a difference of 0.43%), Senegalese (40.6%, a difference of 0.47%), and Barbadian (40.6%, a difference of 0.65%).
| Demographics | Rating | Rank | Currently Married |
| Immigrants | Haiti | 0.0 /100 | #322 | Tragic 41.0% |
| Immigrants | West Indies | 0.0 /100 | #323 | Tragic 40.7% |
| Immigrants | Senegal | 0.0 /100 | #324 | Tragic 40.7% |
| U.S. Virgin Islanders | 0.0 /100 | #325 | Tragic 40.7% |
| Barbadians | 0.0 /100 | #326 | Tragic 40.6% |
| Senegalese | 0.0 /100 | #327 | Tragic 40.6% |
| Arapaho | 0.0 /100 | #328 | Tragic 40.5% |
| Crow | 0.0 /100 | #329 | Tragic 40.4% |
| Immigrants | Dominica | 0.0 /100 | #330 | Tragic 40.3% |
| Immigrants | Barbados | 0.0 /100 | #331 | Tragic 40.3% |
| Immigrants | St. Vincent and the Grenadines | 0.0 /100 | #332 | Tragic 40.1% |
| Yup'ik | 0.0 /100 | #333 | Tragic 39.9% |
| Puerto Ricans | 0.0 /100 | #334 | Tragic 39.9% |
| Lumbee | 0.0 /100 | #335 | Tragic 39.8% |
| British West Indians | 0.0 /100 | #336 | Tragic 39.8% |
Demographics Similar to Immigrants from Afghanistan by Currently Married
In terms of currently married, the demographic groups most similar to Immigrants from Afghanistan are Armenian (46.8%, a difference of 0.0%), Spaniard (46.8%, a difference of 0.020%), Immigrants from Syria (46.8%, a difference of 0.040%), Samoan (46.8%, a difference of 0.060%), and Immigrants from Latvia (46.7%, a difference of 0.060%).
| Demographics | Rating | Rank | Currently Married |
| Immigrants | Southern Europe | 65.9 /100 | #161 | Good 46.9% |
| Immigrants | Nonimmigrants | 65.4 /100 | #162 | Good 46.9% |
| Delaware | 64.7 /100 | #163 | Good 46.9% |
| Immigrants | Western Asia | 64.2 /100 | #164 | Good 46.9% |
| Samoans | 59.8 /100 | #165 | Average 46.8% |
| Immigrants | Syria | 59.3 /100 | #166 | Average 46.8% |
| Spaniards | 58.8 /100 | #167 | Average 46.8% |
| Immigrants | Afghanistan | 58.2 /100 | #168 | Average 46.8% |
| Armenians | 58.2 /100 | #169 | Average 46.8% |
| Immigrants | Latvia | 56.7 /100 | #170 | Average 46.7% |
| Immigrants | Zimbabwe | 52.4 /100 | #171 | Average 46.7% |
| Aleuts | 52.0 /100 | #172 | Average 46.7% |
| Tlingit-Haida | 51.2 /100 | #173 | Average 46.7% |
| Peruvians | 50.0 /100 | #174 | Average 46.6% |
| Immigrants | Brazil | 49.9 /100 | #175 | Average 46.6% |