Crow vs Immigrants from Serbia Single Father Poverty
COMPARE
Crow
Immigrants from Serbia
Single Father Poverty
Single Father Poverty Comparison
Crow
Immigrants from Serbia
30.3%
SINGLE FATHER POVERTY
0.0/ 100
METRIC RATING
345th/ 347
METRIC RANK
15.5%
SINGLE FATHER POVERTY
98.5/ 100
METRIC RATING
92nd/ 347
METRIC RANK
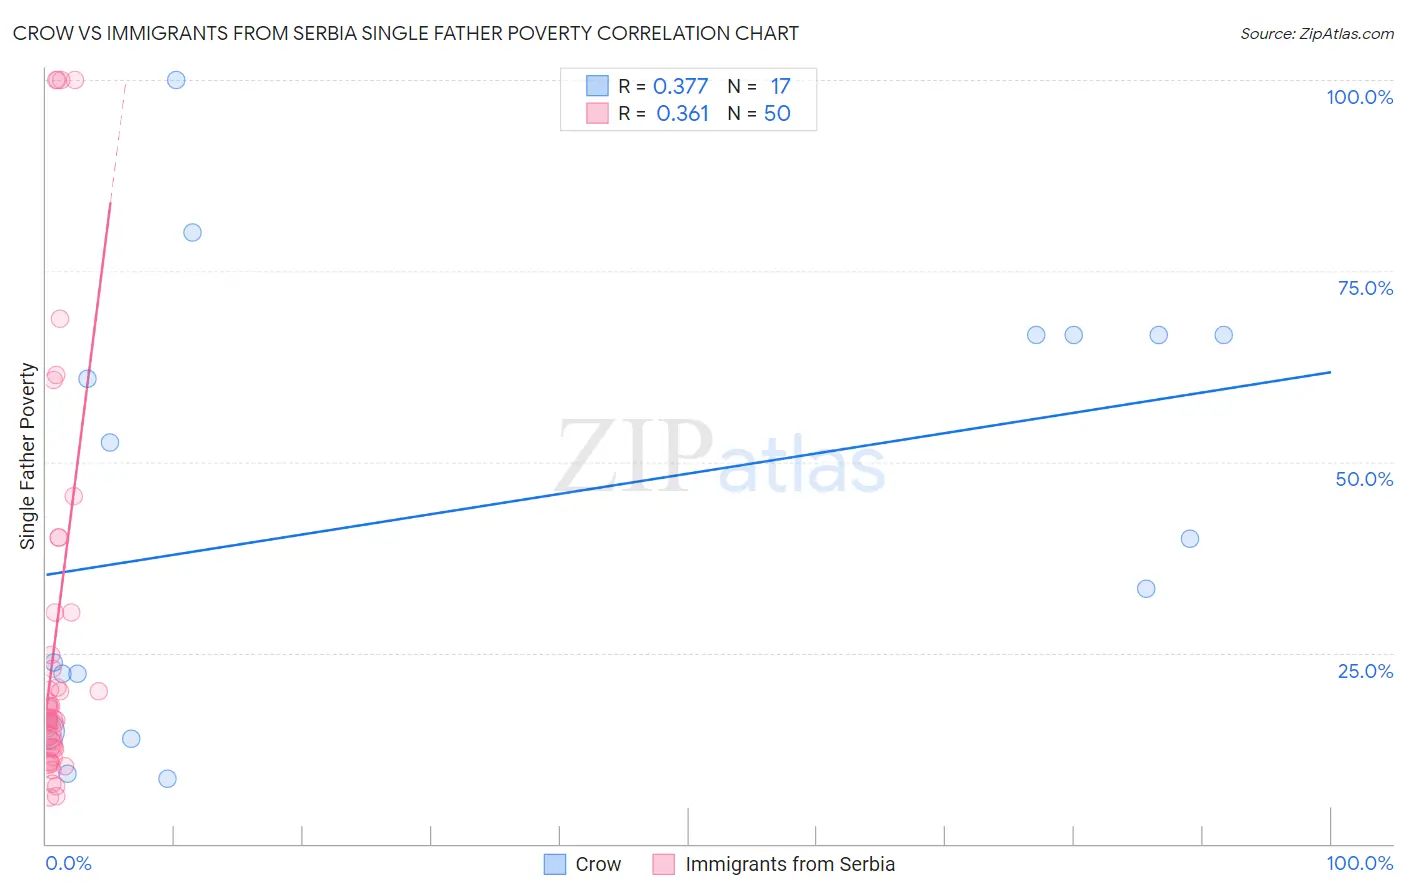
Crow vs Immigrants from Serbia Single Father Poverty Correlation Chart
The statistical analysis conducted on geographies consisting of 55,517,191 people shows a mild positive correlation between the proportion of Crow and poverty level among single fathers in the United States with a correlation coefficient (R) of 0.377 and weighted average of 30.3%. Similarly, the statistical analysis conducted on geographies consisting of 114,512,326 people shows a mild positive correlation between the proportion of Immigrants from Serbia and poverty level among single fathers in the United States with a correlation coefficient (R) of 0.361 and weighted average of 15.5%, a difference of 94.8%.
Single Father Poverty Correlation Summary
| Measurement | Crow | Immigrants from Serbia |
| Minimum | 8.6% | 6.1% |
| Maximum | 100.0% | 100.0% |
| Range | 91.4% | 93.9% |
| Mean | 44.0% | 26.6% |
| Median | 40.0% | 16.4% |
| Interquartile 25% (IQ1) | 18.4% | 12.5% |
| Interquartile 75% (IQ3) | 66.7% | 24.8% |
| Interquartile Range (IQR) | 48.2% | 12.2% |
| Standard Deviation (Sample) | 28.0% | 25.8% |
| Standard Deviation (Population) | 27.2% | 25.6% |
Similar Demographics by Single Father Poverty
Demographics Similar to Crow by Single Father Poverty
In terms of single father poverty, the demographic groups most similar to Crow are Navajo (29.2%, a difference of 3.6%), Puerto Rican (31.5%, a difference of 4.1%), Lumbee (28.5%, a difference of 6.3%), Yuman (28.4%, a difference of 6.7%), and Yup'ik (32.5%, a difference of 7.4%).
| Demographics | Rating | Rank | Single Father Poverty |
| Natives/Alaskans | 0.0 /100 | #333 | Tragic 22.4% |
| Kiowa | 0.0 /100 | #334 | Tragic 22.5% |
| Shoshone | 0.0 /100 | #335 | Tragic 22.9% |
| Cajuns | 0.0 /100 | #336 | Tragic 23.1% |
| Sioux | 0.0 /100 | #337 | Tragic 23.9% |
| Arapaho | 0.0 /100 | #338 | Tragic 24.0% |
| Apache | 0.0 /100 | #339 | Tragic 24.2% |
| Houma | 0.0 /100 | #340 | Tragic 26.7% |
| Hopi | 0.0 /100 | #341 | Tragic 27.2% |
| Yuman | 0.0 /100 | #342 | Tragic 28.4% |
| Lumbee | 0.0 /100 | #343 | Tragic 28.5% |
| Navajo | 0.0 /100 | #344 | Tragic 29.2% |
| Crow | 0.0 /100 | #345 | Tragic 30.3% |
| Puerto Ricans | 0.0 /100 | #346 | Tragic 31.5% |
| Yup'ik | 0.0 /100 | #347 | Tragic 32.5% |
Demographics Similar to Immigrants from Serbia by Single Father Poverty
In terms of single father poverty, the demographic groups most similar to Immigrants from Serbia are Basque (15.5%, a difference of 0.040%), Immigrants from Romania (15.5%, a difference of 0.11%), Immigrants from Uruguay (15.6%, a difference of 0.17%), Mexican American Indian (15.5%, a difference of 0.21%), and Immigrants from Kazakhstan (15.6%, a difference of 0.23%).
| Demographics | Rating | Rank | Single Father Poverty |
| Immigrants | Oceania | 99.1 /100 | #85 | Exceptional 15.4% |
| Immigrants | Russia | 99.0 /100 | #86 | Exceptional 15.5% |
| Brazilians | 99.0 /100 | #87 | Exceptional 15.5% |
| Burmese | 99.0 /100 | #88 | Exceptional 15.5% |
| Immigrants | Korea | 99.0 /100 | #89 | Exceptional 15.5% |
| Mexican American Indians | 98.7 /100 | #90 | Exceptional 15.5% |
| Immigrants | Romania | 98.6 /100 | #91 | Exceptional 15.5% |
| Immigrants | Serbia | 98.5 /100 | #92 | Exceptional 15.5% |
| Basques | 98.4 /100 | #93 | Exceptional 15.5% |
| Immigrants | Uruguay | 98.2 /100 | #94 | Exceptional 15.6% |
| Immigrants | Kazakhstan | 98.2 /100 | #95 | Exceptional 15.6% |
| Immigrants | Belgium | 98.1 /100 | #96 | Exceptional 15.6% |
| Yaqui | 98.1 /100 | #97 | Exceptional 15.6% |
| Zimbabweans | 98.1 /100 | #98 | Exceptional 15.6% |
| Immigrants | Middle Africa | 97.4 /100 | #99 | Exceptional 15.6% |