Crow vs Marshallese Currently Married
COMPARE
Crow
Marshallese
Currently Married
Currently Married Comparison
Crow
Marshallese
40.4%
CURRENTLY MARRIED
0.0/ 100
METRIC RATING
329th/ 347
METRIC RANK
45.5%
CURRENTLY MARRIED
7.2/ 100
METRIC RATING
212th/ 347
METRIC RANK
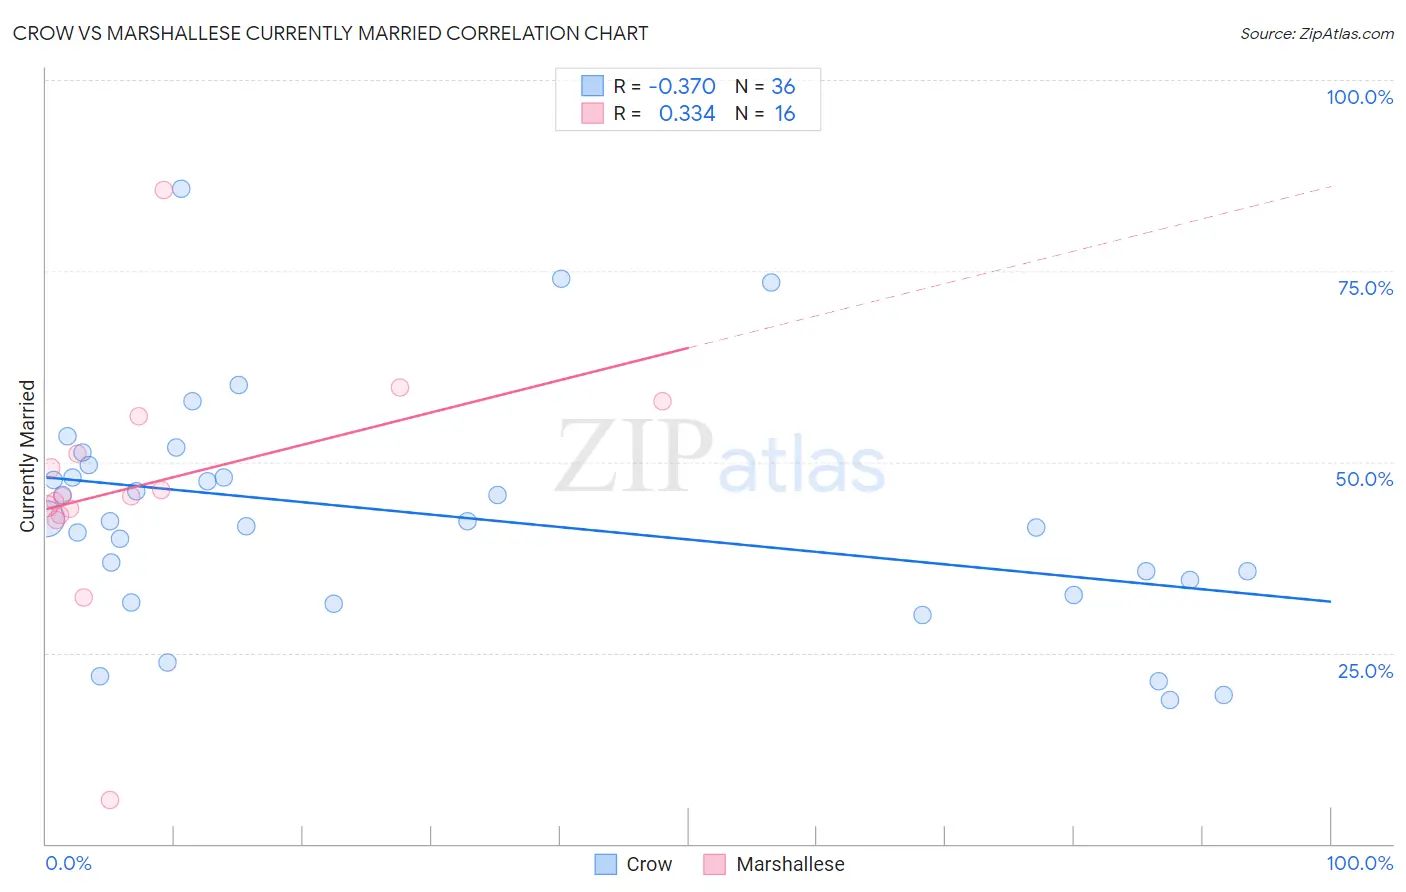
Crow vs Marshallese Currently Married Correlation Chart
The statistical analysis conducted on geographies consisting of 59,208,662 people shows a mild negative correlation between the proportion of Crow and percentage of population currently married in the United States with a correlation coefficient (R) of -0.370 and weighted average of 40.4%. Similarly, the statistical analysis conducted on geographies consisting of 14,761,315 people shows a mild positive correlation between the proportion of Marshallese and percentage of population currently married in the United States with a correlation coefficient (R) of 0.334 and weighted average of 45.5%, a difference of 12.8%.
Currently Married Correlation Summary
| Measurement | Crow | Marshallese |
| Minimum | 18.8% | 5.8% |
| Maximum | 85.8% | 85.6% |
| Range | 67.0% | 79.8% |
| Mean | 43.0% | 47.1% |
| Median | 42.2% | 45.5% |
| Interquartile 25% (IQ1) | 33.5% | 43.5% |
| Interquartile 75% (IQ3) | 48.8% | 53.5% |
| Interquartile Range (IQR) | 15.3% | 10.0% |
| Standard Deviation (Sample) | 15.0% | 16.0% |
| Standard Deviation (Population) | 14.8% | 15.5% |
Similar Demographics by Currently Married
Demographics Similar to Crow by Currently Married
In terms of currently married, the demographic groups most similar to Crow are Immigrants from Dominica (40.3%, a difference of 0.090%), Immigrants from Barbados (40.3%, a difference of 0.10%), Arapaho (40.5%, a difference of 0.43%), Senegalese (40.6%, a difference of 0.47%), and Barbadian (40.6%, a difference of 0.65%).
| Demographics | Rating | Rank | Currently Married |
| Immigrants | Haiti | 0.0 /100 | #322 | Tragic 41.0% |
| Immigrants | West Indies | 0.0 /100 | #323 | Tragic 40.7% |
| Immigrants | Senegal | 0.0 /100 | #324 | Tragic 40.7% |
| U.S. Virgin Islanders | 0.0 /100 | #325 | Tragic 40.7% |
| Barbadians | 0.0 /100 | #326 | Tragic 40.6% |
| Senegalese | 0.0 /100 | #327 | Tragic 40.6% |
| Arapaho | 0.0 /100 | #328 | Tragic 40.5% |
| Crow | 0.0 /100 | #329 | Tragic 40.4% |
| Immigrants | Dominica | 0.0 /100 | #330 | Tragic 40.3% |
| Immigrants | Barbados | 0.0 /100 | #331 | Tragic 40.3% |
| Immigrants | St. Vincent and the Grenadines | 0.0 /100 | #332 | Tragic 40.1% |
| Yup'ik | 0.0 /100 | #333 | Tragic 39.9% |
| Puerto Ricans | 0.0 /100 | #334 | Tragic 39.9% |
| Lumbee | 0.0 /100 | #335 | Tragic 39.8% |
| British West Indians | 0.0 /100 | #336 | Tragic 39.8% |
Demographics Similar to Marshallese by Currently Married
In terms of currently married, the demographic groups most similar to Marshallese are Houma (45.5%, a difference of 0.010%), Alaska Native (45.5%, a difference of 0.030%), Dutch West Indian (45.5%, a difference of 0.070%), German Russian (45.5%, a difference of 0.070%), and Uruguayan (45.6%, a difference of 0.090%).
| Demographics | Rating | Rank | Currently Married |
| South American Indians | 11.5 /100 | #205 | Poor 45.8% |
| Immigrants | Immigrants | 11.2 /100 | #206 | Poor 45.8% |
| Immigrants | South America | 10.8 /100 | #207 | Poor 45.7% |
| Alsatians | 10.8 /100 | #208 | Poor 45.7% |
| Immigrants | Micronesia | 8.8 /100 | #209 | Tragic 45.6% |
| Uruguayans | 7.9 /100 | #210 | Tragic 45.6% |
| Houma | 7.2 /100 | #211 | Tragic 45.5% |
| Marshallese | 7.2 /100 | #212 | Tragic 45.5% |
| Alaska Natives | 7.0 /100 | #213 | Tragic 45.5% |
| Dutch West Indians | 6.7 /100 | #214 | Tragic 45.5% |
| German Russians | 6.7 /100 | #215 | Tragic 45.5% |
| Immigrants | Morocco | 5.5 /100 | #216 | Tragic 45.4% |
| Immigrants | Thailand | 5.1 /100 | #217 | Tragic 45.4% |
| Panamanians | 4.0 /100 | #218 | Tragic 45.3% |
| Immigrants | Portugal | 3.5 /100 | #219 | Tragic 45.2% |