American vs Cree College, 1 year or more
COMPARE
American
Cree
College, 1 year or more
College, 1 year or more Comparison
Americans
Cree
54.4%
COLLEGE, 1 YEAR OR MORE
0.2/ 100
METRIC RATING
275th/ 347
METRIC RANK
56.8%
COLLEGE, 1 YEAR OR MORE
3.6/ 100
METRIC RATING
229th/ 347
METRIC RANK
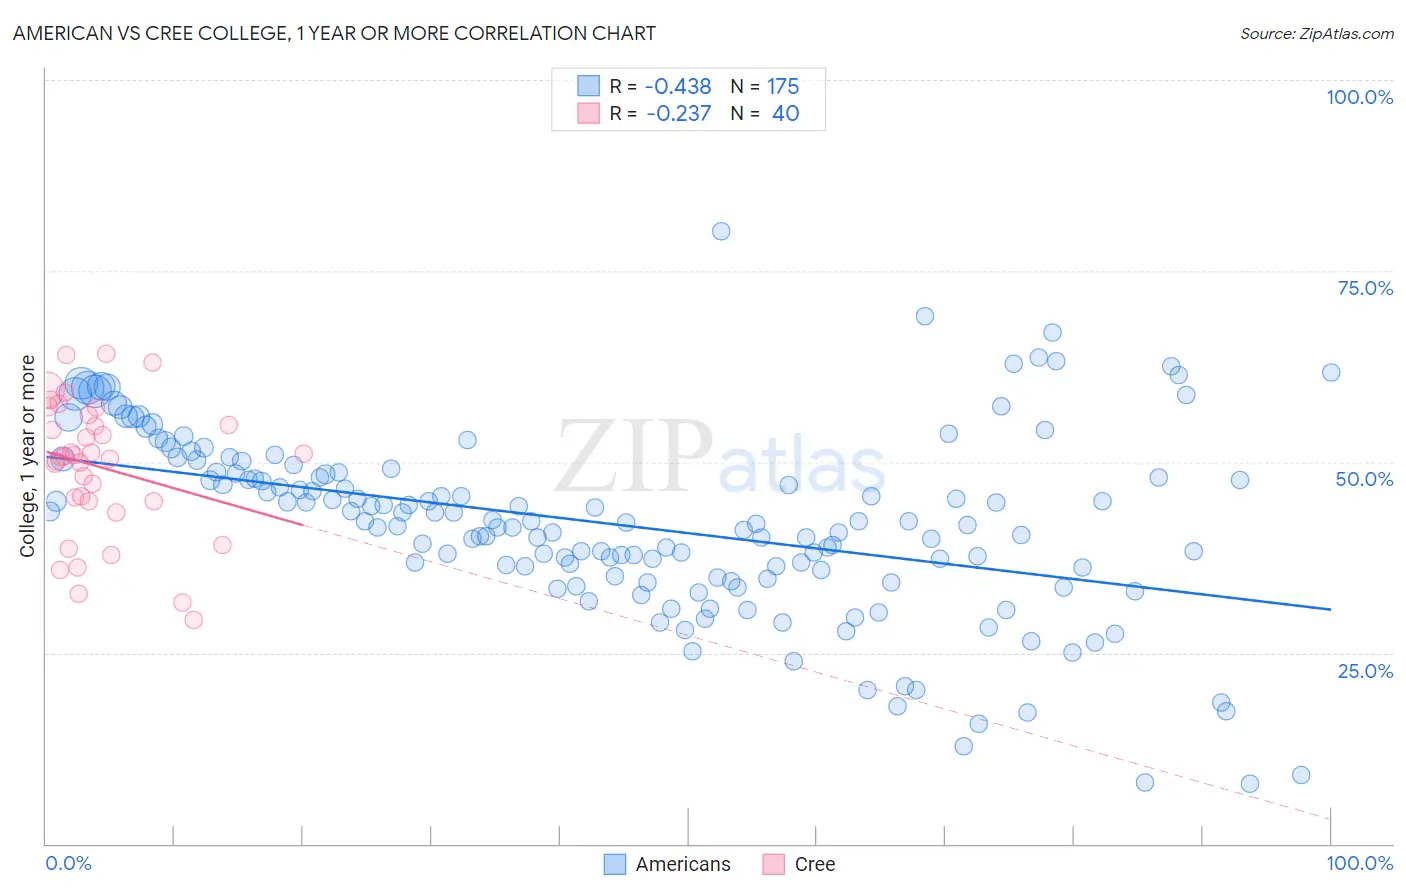
American vs Cree College, 1 year or more Correlation Chart
The statistical analysis conducted on geographies consisting of 581,967,268 people shows a moderate negative correlation between the proportion of Americans and percentage of population with at least college, 1 year or more education in the United States with a correlation coefficient (R) of -0.438 and weighted average of 54.4%. Similarly, the statistical analysis conducted on geographies consisting of 76,211,685 people shows a weak negative correlation between the proportion of Cree and percentage of population with at least college, 1 year or more education in the United States with a correlation coefficient (R) of -0.237 and weighted average of 56.8%, a difference of 4.5%.
College, 1 year or more Correlation Summary
| Measurement | American | Cree |
| Minimum | 7.8% | 29.2% |
| Maximum | 80.1% | 64.2% |
| Range | 72.3% | 35.0% |
| Mean | 41.8% | 49.3% |
| Median | 42.0% | 50.6% |
| Interquartile 25% (IQ1) | 35.0% | 44.8% |
| Interquartile 75% (IQ3) | 48.5% | 55.5% |
| Interquartile Range (IQR) | 13.6% | 10.7% |
| Standard Deviation (Sample) | 12.1% | 8.9% |
| Standard Deviation (Population) | 12.0% | 8.8% |
Similar Demographics by College, 1 year or more
Demographics Similar to Americans by College, 1 year or more
In terms of college, 1 year or more, the demographic groups most similar to Americans are Belizean (54.4%, a difference of 0.020%), Immigrants from Grenada (54.4%, a difference of 0.060%), Shoshone (54.3%, a difference of 0.080%), Comanche (54.4%, a difference of 0.10%), and Ecuadorian (54.3%, a difference of 0.12%).
| Demographics | Rating | Rank | College, 1 year or more |
| British West Indians | 0.2 /100 | #268 | Tragic 54.5% |
| Bangladeshis | 0.2 /100 | #269 | Tragic 54.5% |
| Crow | 0.2 /100 | #270 | Tragic 54.5% |
| Bahamians | 0.2 /100 | #271 | Tragic 54.5% |
| Comanche | 0.2 /100 | #272 | Tragic 54.4% |
| Immigrants | Grenada | 0.2 /100 | #273 | Tragic 54.4% |
| Belizeans | 0.2 /100 | #274 | Tragic 54.4% |
| Americans | 0.2 /100 | #275 | Tragic 54.4% |
| Shoshone | 0.2 /100 | #276 | Tragic 54.3% |
| Ecuadorians | 0.2 /100 | #277 | Tragic 54.3% |
| Immigrants | Jamaica | 0.1 /100 | #278 | Tragic 54.2% |
| Arapaho | 0.1 /100 | #279 | Tragic 54.1% |
| Cheyenne | 0.1 /100 | #280 | Tragic 54.1% |
| Colville | 0.1 /100 | #281 | Tragic 54.1% |
| Guyanese | 0.1 /100 | #282 | Tragic 54.1% |
Demographics Similar to Cree by College, 1 year or more
In terms of college, 1 year or more, the demographic groups most similar to Cree are Immigrants from Fiji (56.9%, a difference of 0.13%), Liberian (56.7%, a difference of 0.22%), Immigrants (57.0%, a difference of 0.28%), Immigrants from Western Africa (57.0%, a difference of 0.35%), and Vietnamese (57.0%, a difference of 0.37%).
| Demographics | Rating | Rank | College, 1 year or more |
| Sub-Saharan Africans | 6.1 /100 | #222 | Tragic 57.3% |
| Portuguese | 5.4 /100 | #223 | Tragic 57.2% |
| Hmong | 5.4 /100 | #224 | Tragic 57.2% |
| Vietnamese | 4.7 /100 | #225 | Tragic 57.0% |
| Immigrants | Western Africa | 4.6 /100 | #226 | Tragic 57.0% |
| Immigrants | Immigrants | 4.4 /100 | #227 | Tragic 57.0% |
| Immigrants | Fiji | 4.0 /100 | #228 | Tragic 56.9% |
| Cree | 3.6 /100 | #229 | Tragic 56.8% |
| Liberians | 3.1 /100 | #230 | Tragic 56.7% |
| Immigrants | Burma/Myanmar | 2.7 /100 | #231 | Tragic 56.6% |
| Immigrants | Bangladesh | 2.6 /100 | #232 | Tragic 56.6% |
| Immigrants | Nonimmigrants | 2.5 /100 | #233 | Tragic 56.5% |
| Spanish Americans | 1.8 /100 | #234 | Tragic 56.3% |
| West Indians | 1.8 /100 | #235 | Tragic 56.3% |
| Iroquois | 1.7 /100 | #236 | Tragic 56.2% |