American vs Venezuelan College, 1 year or more
COMPARE
American
Venezuelan
College, 1 year or more
College, 1 year or more Comparison
Americans
Venezuelans
54.4%
COLLEGE, 1 YEAR OR MORE
0.2/ 100
METRIC RATING
275th/ 347
METRIC RANK
61.3%
COLLEGE, 1 YEAR OR MORE
92.1/ 100
METRIC RATING
124th/ 347
METRIC RANK
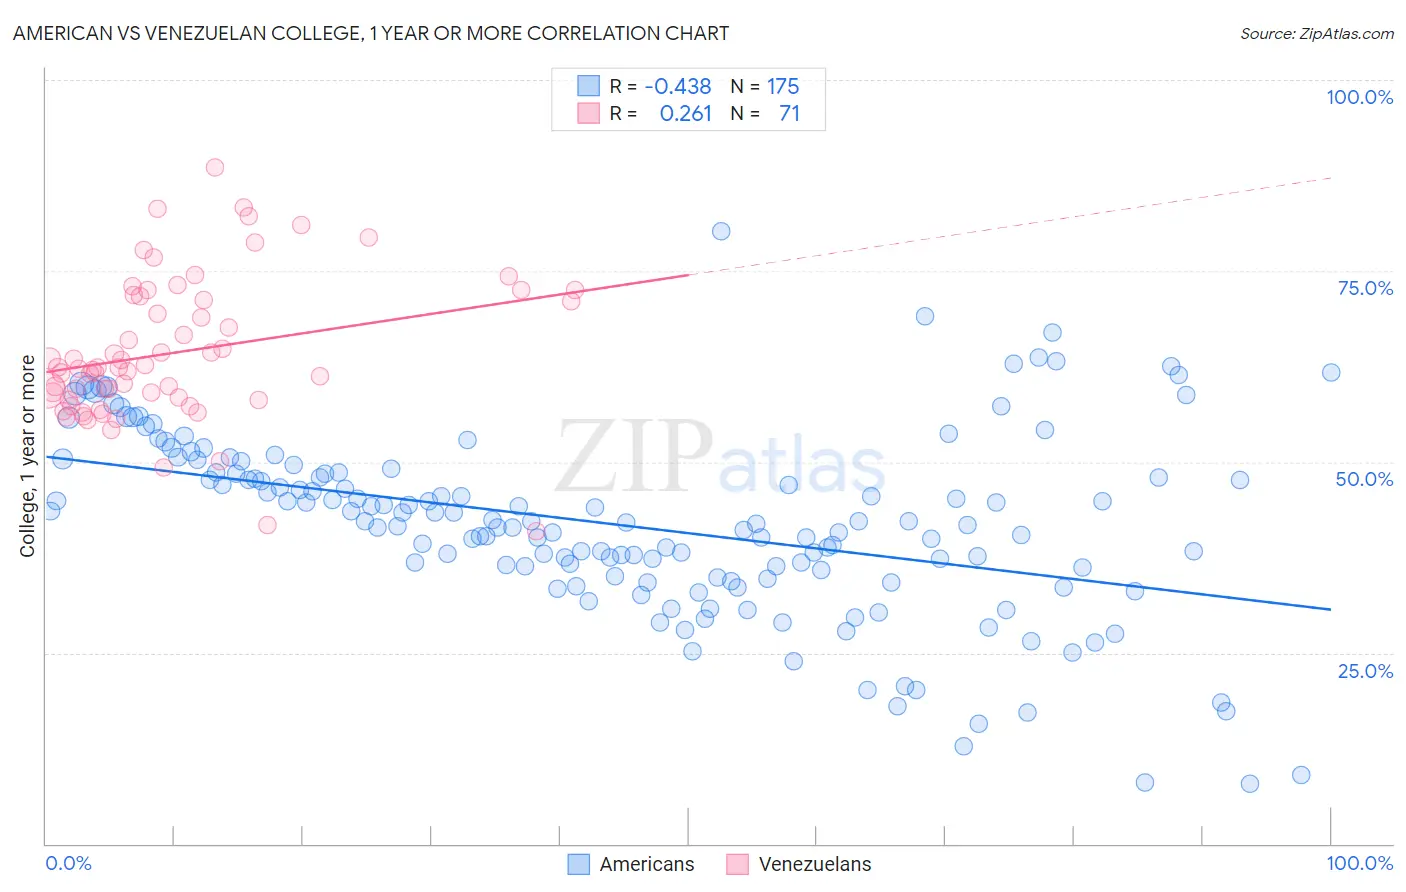
American vs Venezuelan College, 1 year or more Correlation Chart
The statistical analysis conducted on geographies consisting of 581,967,268 people shows a moderate negative correlation between the proportion of Americans and percentage of population with at least college, 1 year or more education in the United States with a correlation coefficient (R) of -0.438 and weighted average of 54.4%. Similarly, the statistical analysis conducted on geographies consisting of 306,322,543 people shows a weak positive correlation between the proportion of Venezuelans and percentage of population with at least college, 1 year or more education in the United States with a correlation coefficient (R) of 0.261 and weighted average of 61.3%, a difference of 12.8%.
College, 1 year or more Correlation Summary
| Measurement | American | Venezuelan |
| Minimum | 7.8% | 41.0% |
| Maximum | 80.1% | 88.6% |
| Range | 72.3% | 47.7% |
| Mean | 41.8% | 64.3% |
| Median | 42.0% | 62.4% |
| Interquartile 25% (IQ1) | 35.0% | 58.1% |
| Interquartile 75% (IQ3) | 48.5% | 71.7% |
| Interquartile Range (IQR) | 13.6% | 13.6% |
| Standard Deviation (Sample) | 12.1% | 9.4% |
| Standard Deviation (Population) | 12.0% | 9.3% |
Similar Demographics by College, 1 year or more
Demographics Similar to Americans by College, 1 year or more
In terms of college, 1 year or more, the demographic groups most similar to Americans are Belizean (54.4%, a difference of 0.020%), Immigrants from Grenada (54.4%, a difference of 0.060%), Shoshone (54.3%, a difference of 0.080%), Comanche (54.4%, a difference of 0.10%), and Ecuadorian (54.3%, a difference of 0.12%).
| Demographics | Rating | Rank | College, 1 year or more |
| British West Indians | 0.2 /100 | #268 | Tragic 54.5% |
| Bangladeshis | 0.2 /100 | #269 | Tragic 54.5% |
| Crow | 0.2 /100 | #270 | Tragic 54.5% |
| Bahamians | 0.2 /100 | #271 | Tragic 54.5% |
| Comanche | 0.2 /100 | #272 | Tragic 54.4% |
| Immigrants | Grenada | 0.2 /100 | #273 | Tragic 54.4% |
| Belizeans | 0.2 /100 | #274 | Tragic 54.4% |
| Americans | 0.2 /100 | #275 | Tragic 54.4% |
| Shoshone | 0.2 /100 | #276 | Tragic 54.3% |
| Ecuadorians | 0.2 /100 | #277 | Tragic 54.3% |
| Immigrants | Jamaica | 0.1 /100 | #278 | Tragic 54.2% |
| Arapaho | 0.1 /100 | #279 | Tragic 54.1% |
| Cheyenne | 0.1 /100 | #280 | Tragic 54.1% |
| Colville | 0.1 /100 | #281 | Tragic 54.1% |
| Guyanese | 0.1 /100 | #282 | Tragic 54.1% |
Demographics Similar to Venezuelans by College, 1 year or more
In terms of college, 1 year or more, the demographic groups most similar to Venezuelans are Serbian (61.4%, a difference of 0.030%), Immigrants from Chile (61.4%, a difference of 0.040%), Immigrants from Syria (61.3%, a difference of 0.080%), Immigrants from Jordan (61.4%, a difference of 0.12%), and Alsatian (61.3%, a difference of 0.13%).
| Demographics | Rating | Rank | College, 1 year or more |
| Arabs | 93.9 /100 | #117 | Exceptional 61.6% |
| Immigrants | Brazil | 93.9 /100 | #118 | Exceptional 61.6% |
| Assyrians/Chaldeans/Syriacs | 93.3 /100 | #119 | Exceptional 61.5% |
| Pakistanis | 93.2 /100 | #120 | Exceptional 61.5% |
| Immigrants | Jordan | 92.7 /100 | #121 | Exceptional 61.4% |
| Immigrants | Chile | 92.3 /100 | #122 | Exceptional 61.4% |
| Serbians | 92.2 /100 | #123 | Exceptional 61.4% |
| Venezuelans | 92.1 /100 | #124 | Exceptional 61.3% |
| Immigrants | Syria | 91.6 /100 | #125 | Exceptional 61.3% |
| Alsatians | 91.3 /100 | #126 | Exceptional 61.3% |
| Immigrants | Eastern Africa | 91.1 /100 | #127 | Exceptional 61.2% |
| Immigrants | Italy | 91.1 /100 | #128 | Exceptional 61.2% |
| Ugandans | 90.7 /100 | #129 | Exceptional 61.2% |
| Italians | 89.5 /100 | #130 | Excellent 61.1% |
| Immigrants | Morocco | 89.5 /100 | #131 | Excellent 61.1% |