American vs Irish College, 1 year or more
COMPARE
American
Irish
College, 1 year or more
College, 1 year or more Comparison
Americans
Irish
54.4%
COLLEGE, 1 YEAR OR MORE
0.2/ 100
METRIC RATING
275th/ 347
METRIC RANK
59.6%
COLLEGE, 1 YEAR OR MORE
56.1/ 100
METRIC RATING
165th/ 347
METRIC RANK
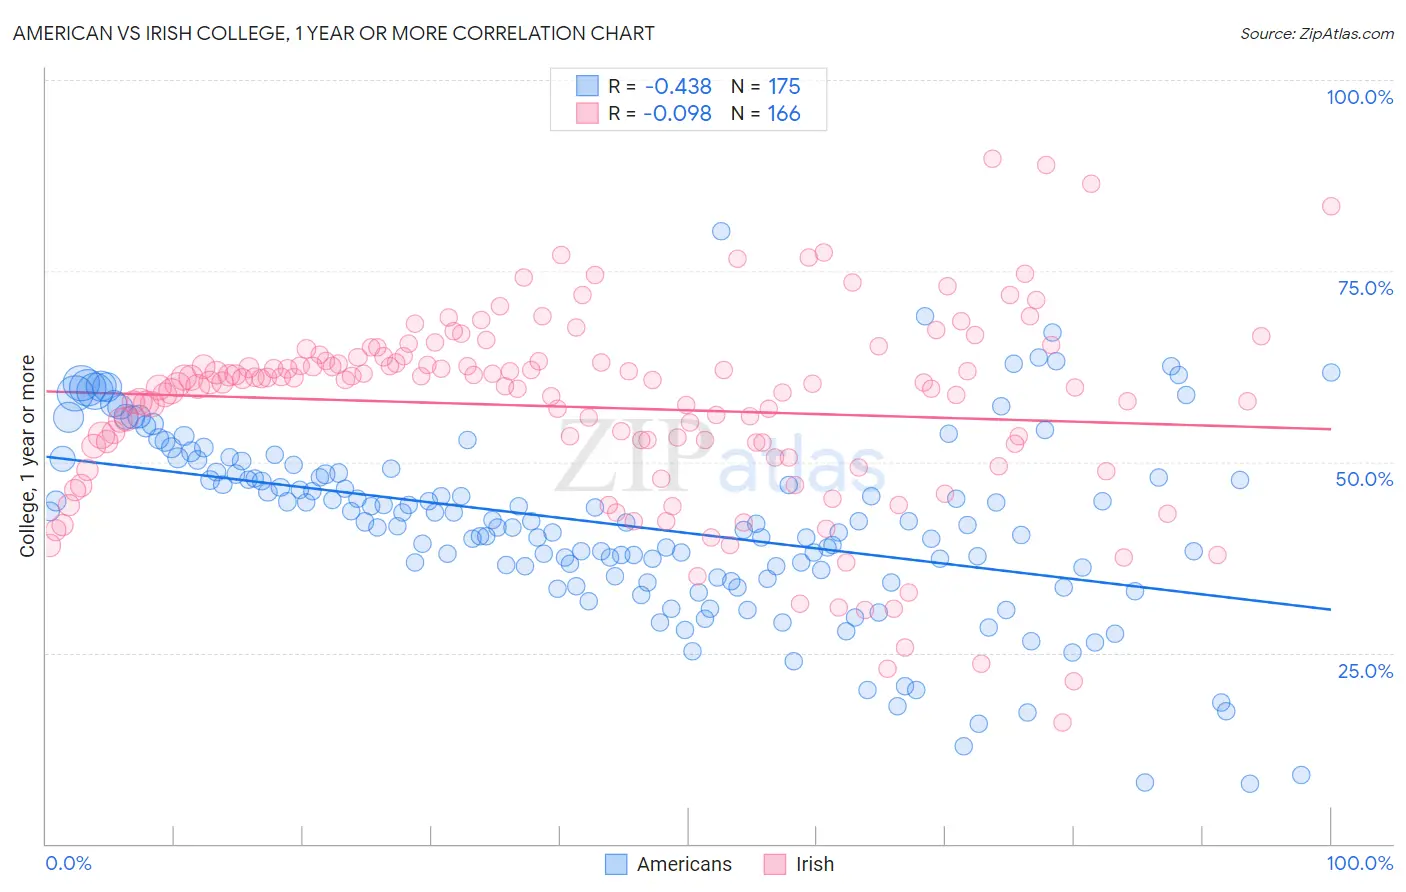
American vs Irish College, 1 year or more Correlation Chart
The statistical analysis conducted on geographies consisting of 581,967,268 people shows a moderate negative correlation between the proportion of Americans and percentage of population with at least college, 1 year or more education in the United States with a correlation coefficient (R) of -0.438 and weighted average of 54.4%. Similarly, the statistical analysis conducted on geographies consisting of 580,683,064 people shows a slight negative correlation between the proportion of Irish and percentage of population with at least college, 1 year or more education in the United States with a correlation coefficient (R) of -0.098 and weighted average of 59.6%, a difference of 9.6%.
College, 1 year or more Correlation Summary
| Measurement | American | Irish |
| Minimum | 7.8% | 16.0% |
| Maximum | 80.1% | 89.7% |
| Range | 72.3% | 73.7% |
| Mean | 41.8% | 57.1% |
| Median | 42.0% | 60.3% |
| Interquartile 25% (IQ1) | 35.0% | 52.0% |
| Interquartile 75% (IQ3) | 48.5% | 63.2% |
| Interquartile Range (IQR) | 13.6% | 11.2% |
| Standard Deviation (Sample) | 12.1% | 12.7% |
| Standard Deviation (Population) | 12.0% | 12.6% |
Similar Demographics by College, 1 year or more
Demographics Similar to Americans by College, 1 year or more
In terms of college, 1 year or more, the demographic groups most similar to Americans are Belizean (54.4%, a difference of 0.020%), Immigrants from Grenada (54.4%, a difference of 0.060%), Shoshone (54.3%, a difference of 0.080%), Comanche (54.4%, a difference of 0.10%), and Ecuadorian (54.3%, a difference of 0.12%).
| Demographics | Rating | Rank | College, 1 year or more |
| British West Indians | 0.2 /100 | #268 | Tragic 54.5% |
| Bangladeshis | 0.2 /100 | #269 | Tragic 54.5% |
| Crow | 0.2 /100 | #270 | Tragic 54.5% |
| Bahamians | 0.2 /100 | #271 | Tragic 54.5% |
| Comanche | 0.2 /100 | #272 | Tragic 54.4% |
| Immigrants | Grenada | 0.2 /100 | #273 | Tragic 54.4% |
| Belizeans | 0.2 /100 | #274 | Tragic 54.4% |
| Americans | 0.2 /100 | #275 | Tragic 54.4% |
| Shoshone | 0.2 /100 | #276 | Tragic 54.3% |
| Ecuadorians | 0.2 /100 | #277 | Tragic 54.3% |
| Immigrants | Jamaica | 0.1 /100 | #278 | Tragic 54.2% |
| Arapaho | 0.1 /100 | #279 | Tragic 54.1% |
| Cheyenne | 0.1 /100 | #280 | Tragic 54.1% |
| Colville | 0.1 /100 | #281 | Tragic 54.1% |
| Guyanese | 0.1 /100 | #282 | Tragic 54.1% |
Demographics Similar to Irish by College, 1 year or more
In terms of college, 1 year or more, the demographic groups most similar to Irish are Immigrants from Africa (59.6%, a difference of 0.0%), Belgian (59.7%, a difference of 0.11%), Immigrants from Somalia (59.7%, a difference of 0.12%), Korean (59.7%, a difference of 0.13%), and Immigrants from North Macedonia (59.5%, a difference of 0.16%).
| Demographics | Rating | Rank | College, 1 year or more |
| English | 67.2 /100 | #158 | Good 60.0% |
| Immigrants | Iraq | 67.0 /100 | #159 | Good 60.0% |
| South American Indians | 66.9 /100 | #160 | Good 60.0% |
| Somalis | 64.5 /100 | #161 | Good 59.9% |
| Koreans | 58.5 /100 | #162 | Average 59.7% |
| Immigrants | Somalia | 58.3 /100 | #163 | Average 59.7% |
| Belgians | 58.1 /100 | #164 | Average 59.7% |
| Irish | 56.1 /100 | #165 | Average 59.6% |
| Immigrants | Africa | 56.1 /100 | #166 | Average 59.6% |
| Immigrants | North Macedonia | 53.1 /100 | #167 | Average 59.5% |
| Hungarians | 52.9 /100 | #168 | Average 59.5% |
| Immigrants | Southern Europe | 52.7 /100 | #169 | Average 59.5% |
| Welsh | 52.4 /100 | #170 | Average 59.5% |
| Immigrants | Albania | 52.3 /100 | #171 | Average 59.5% |
| Immigrants | Sierra Leone | 52.2 /100 | #172 | Average 59.5% |