Mexican American Indian vs Irish Nursery School
COMPARE
Mexican American Indian
Irish
Nursery School
Nursery School Comparison
Mexican American Indians
Irish
96.9%
NURSERY SCHOOL
0.0/ 100
METRIC RATING
322nd/ 347
METRIC RANK
98.6%
NURSERY SCHOOL
100.0/ 100
METRIC RATING
19th/ 347
METRIC RANK
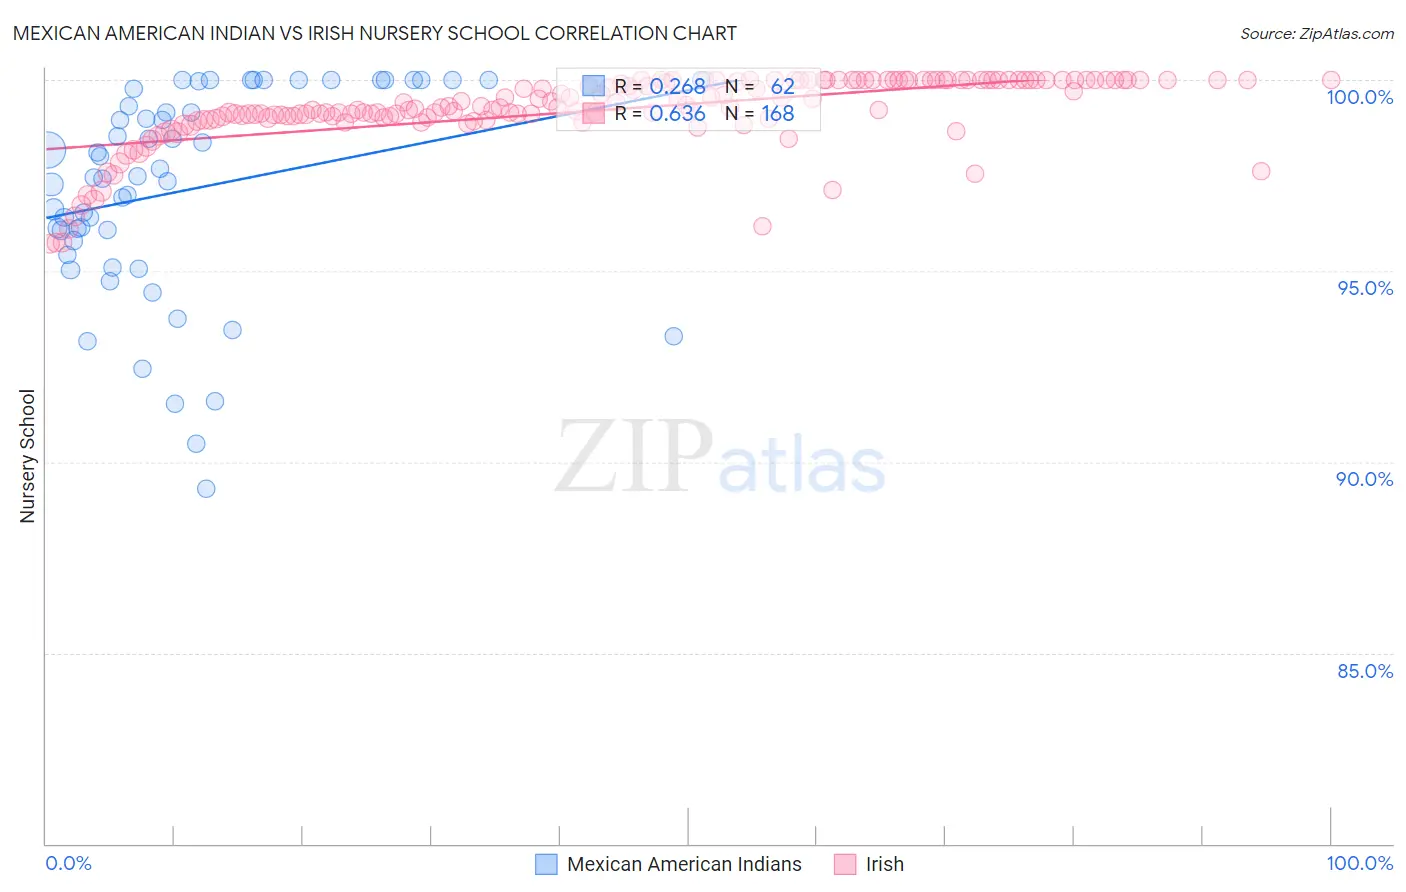
Mexican American Indian vs Irish Nursery School Correlation Chart
The statistical analysis conducted on geographies consisting of 317,619,717 people shows a weak positive correlation between the proportion of Mexican American Indians and percentage of population with at least nursery school education in the United States with a correlation coefficient (R) of 0.268 and weighted average of 96.9%. Similarly, the statistical analysis conducted on geographies consisting of 580,708,963 people shows a significant positive correlation between the proportion of Irish and percentage of population with at least nursery school education in the United States with a correlation coefficient (R) of 0.636 and weighted average of 98.6%, a difference of 1.8%.
Nursery School Correlation Summary
| Measurement | Mexican American Indian | Irish |
| Minimum | 89.3% | 95.7% |
| Maximum | 100.0% | 100.0% |
| Range | 10.7% | 4.3% |
| Mean | 97.1% | 99.2% |
| Median | 97.5% | 99.3% |
| Interquartile 25% (IQ1) | 95.8% | 99.0% |
| Interquartile 75% (IQ3) | 99.8% | 100.0% |
| Interquartile Range (IQR) | 4.0% | 1.00% |
| Standard Deviation (Sample) | 2.7% | 0.94% |
| Standard Deviation (Population) | 2.7% | 0.94% |
Similar Demographics by Nursery School
Demographics Similar to Mexican American Indians by Nursery School
In terms of nursery school, the demographic groups most similar to Mexican American Indians are Immigrants from Honduras (96.9%, a difference of 0.0%), Immigrants from Laos (96.9%, a difference of 0.020%), Immigrants from Burma/Myanmar (96.9%, a difference of 0.020%), Immigrants from Bangladesh (96.9%, a difference of 0.020%), and Vietnamese (96.8%, a difference of 0.020%).
| Demographics | Rating | Rank | Nursery School |
| Immigrants | Nicaragua | 0.0 /100 | #315 | Tragic 96.9% |
| Immigrants | Belize | 0.0 /100 | #316 | Tragic 96.9% |
| Immigrants | Ecuador | 0.0 /100 | #317 | Tragic 96.9% |
| Immigrants | Guyana | 0.0 /100 | #318 | Tragic 96.9% |
| Immigrants | Laos | 0.0 /100 | #319 | Tragic 96.9% |
| Immigrants | Burma/Myanmar | 0.0 /100 | #320 | Tragic 96.9% |
| Immigrants | Bangladesh | 0.0 /100 | #321 | Tragic 96.9% |
| Mexican American Indians | 0.0 /100 | #322 | Tragic 96.9% |
| Immigrants | Honduras | 0.0 /100 | #323 | Tragic 96.9% |
| Vietnamese | 0.0 /100 | #324 | Tragic 96.8% |
| Dominicans | 0.0 /100 | #325 | Tragic 96.8% |
| Indonesians | 0.0 /100 | #326 | Tragic 96.8% |
| Mexicans | 0.0 /100 | #327 | Tragic 96.8% |
| Immigrants | Latin America | 0.0 /100 | #328 | Tragic 96.7% |
| Immigrants | Vietnam | 0.0 /100 | #329 | Tragic 96.7% |
Demographics Similar to Irish by Nursery School
In terms of nursery school, the demographic groups most similar to Irish are Pennsylvania German (98.6%, a difference of 0.010%), Finnish (98.6%, a difference of 0.010%), Lithuanian (98.6%, a difference of 0.010%), Polish (98.6%, a difference of 0.010%), and Danish (98.6%, a difference of 0.010%).
| Demographics | Rating | Rank | Nursery School |
| Slovenes | 100.0 /100 | #12 | Exceptional 98.7% |
| English | 100.0 /100 | #13 | Exceptional 98.7% |
| Carpatho Rusyns | 100.0 /100 | #14 | Exceptional 98.7% |
| Swedes | 100.0 /100 | #15 | Exceptional 98.7% |
| Scottish | 100.0 /100 | #16 | Exceptional 98.7% |
| Aleuts | 100.0 /100 | #17 | Exceptional 98.7% |
| Dutch | 100.0 /100 | #18 | Exceptional 98.7% |
| Irish | 100.0 /100 | #19 | Exceptional 98.6% |
| Pennsylvania Germans | 100.0 /100 | #20 | Exceptional 98.6% |
| Finns | 100.0 /100 | #21 | Exceptional 98.6% |
| Lithuanians | 100.0 /100 | #22 | Exceptional 98.6% |
| Poles | 100.0 /100 | #23 | Exceptional 98.6% |
| Danes | 100.0 /100 | #24 | Exceptional 98.6% |
| Scotch-Irish | 100.0 /100 | #25 | Exceptional 98.6% |
| Sioux | 100.0 /100 | #26 | Exceptional 98.6% |