Yuman vs Irish Nursery School
COMPARE
Yuman
Irish
Nursery School
Nursery School Comparison
Yuman
Irish
97.9%
NURSERY SCHOOL
25.7/ 100
METRIC RATING
197th/ 347
METRIC RANK
98.6%
NURSERY SCHOOL
100.0/ 100
METRIC RATING
19th/ 347
METRIC RANK
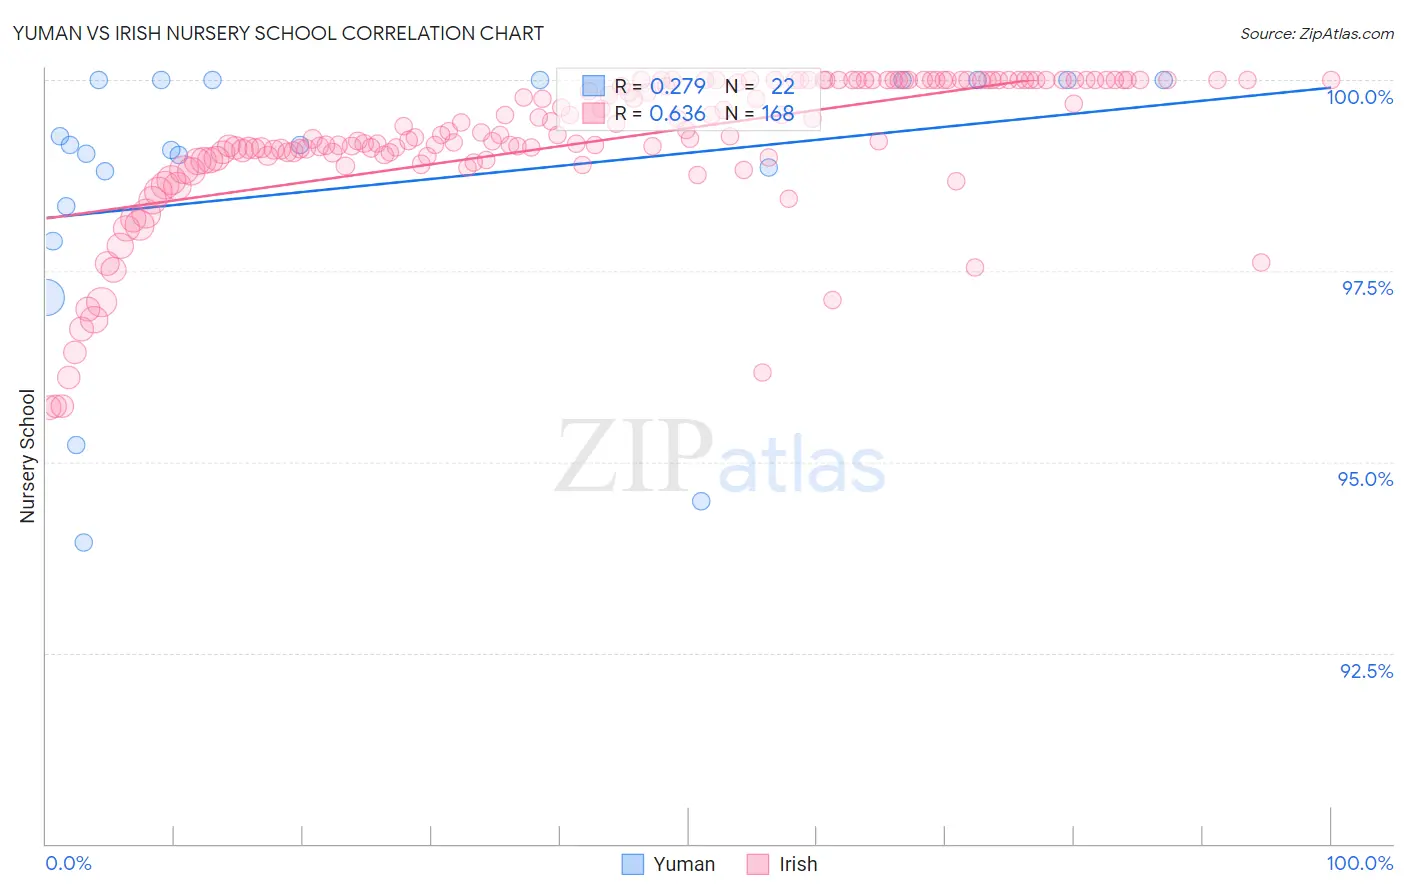
Yuman vs Irish Nursery School Correlation Chart
The statistical analysis conducted on geographies consisting of 40,696,229 people shows a weak positive correlation between the proportion of Yuman and percentage of population with at least nursery school education in the United States with a correlation coefficient (R) of 0.279 and weighted average of 97.9%. Similarly, the statistical analysis conducted on geographies consisting of 580,708,963 people shows a significant positive correlation between the proportion of Irish and percentage of population with at least nursery school education in the United States with a correlation coefficient (R) of 0.636 and weighted average of 98.6%, a difference of 0.75%.
Nursery School Correlation Summary
| Measurement | Yuman | Irish |
| Minimum | 93.9% | 95.7% |
| Maximum | 100.0% | 100.0% |
| Range | 6.1% | 4.3% |
| Mean | 98.6% | 99.2% |
| Median | 99.1% | 99.3% |
| Interquartile 25% (IQ1) | 98.3% | 99.0% |
| Interquartile 75% (IQ3) | 100.0% | 100.0% |
| Interquartile Range (IQR) | 1.7% | 1.00% |
| Standard Deviation (Sample) | 1.8% | 0.94% |
| Standard Deviation (Population) | 1.8% | 0.94% |
Similar Demographics by Nursery School
Demographics Similar to Yuman by Nursery School
In terms of nursery school, the demographic groups most similar to Yuman are Guamanian/Chamorro (97.9%, a difference of 0.0%), Black/African American (97.9%, a difference of 0.010%), Paraguayan (97.9%, a difference of 0.010%), Mongolian (97.9%, a difference of 0.010%), and Hawaiian (97.9%, a difference of 0.010%).
| Demographics | Rating | Rank | Nursery School |
| Panamanians | 34.3 /100 | #190 | Fair 97.9% |
| Immigrants | Taiwan | 30.6 /100 | #191 | Fair 97.9% |
| Blacks/African Americans | 29.4 /100 | #192 | Fair 97.9% |
| Paraguayans | 27.4 /100 | #193 | Fair 97.9% |
| Mongolians | 27.3 /100 | #194 | Fair 97.9% |
| Hawaiians | 27.2 /100 | #195 | Fair 97.9% |
| Guamanians/Chamorros | 25.7 /100 | #196 | Fair 97.9% |
| Yuman | 25.7 /100 | #197 | Fair 97.9% |
| Immigrants | Kenya | 24.1 /100 | #198 | Fair 97.9% |
| Immigrants | Egypt | 22.5 /100 | #199 | Fair 97.9% |
| Tohono O'odham | 22.2 /100 | #200 | Fair 97.9% |
| Immigrants | Lebanon | 21.2 /100 | #201 | Fair 97.9% |
| Immigrants | Ukraine | 19.9 /100 | #202 | Poor 97.9% |
| Immigrants | Uganda | 18.0 /100 | #203 | Poor 97.9% |
| Immigrants | Southern Europe | 17.4 /100 | #204 | Poor 97.9% |
Demographics Similar to Irish by Nursery School
In terms of nursery school, the demographic groups most similar to Irish are Pennsylvania German (98.6%, a difference of 0.010%), Finnish (98.6%, a difference of 0.010%), Lithuanian (98.6%, a difference of 0.010%), Polish (98.6%, a difference of 0.010%), and Danish (98.6%, a difference of 0.010%).
| Demographics | Rating | Rank | Nursery School |
| Slovenes | 100.0 /100 | #12 | Exceptional 98.7% |
| English | 100.0 /100 | #13 | Exceptional 98.7% |
| Carpatho Rusyns | 100.0 /100 | #14 | Exceptional 98.7% |
| Swedes | 100.0 /100 | #15 | Exceptional 98.7% |
| Scottish | 100.0 /100 | #16 | Exceptional 98.7% |
| Aleuts | 100.0 /100 | #17 | Exceptional 98.7% |
| Dutch | 100.0 /100 | #18 | Exceptional 98.7% |
| Irish | 100.0 /100 | #19 | Exceptional 98.6% |
| Pennsylvania Germans | 100.0 /100 | #20 | Exceptional 98.6% |
| Finns | 100.0 /100 | #21 | Exceptional 98.6% |
| Lithuanians | 100.0 /100 | #22 | Exceptional 98.6% |
| Poles | 100.0 /100 | #23 | Exceptional 98.6% |
| Danes | 100.0 /100 | #24 | Exceptional 98.6% |
| Scotch-Irish | 100.0 /100 | #25 | Exceptional 98.6% |
| Sioux | 100.0 /100 | #26 | Exceptional 98.6% |