Mexican American Indian vs Albanian Nursery School
COMPARE
Mexican American Indian
Albanian
Nursery School
Nursery School Comparison
Mexican American Indians
Albanians
96.9%
NURSERY SCHOOL
0.0/ 100
METRIC RATING
322nd/ 347
METRIC RANK
98.0%
NURSERY SCHOOL
48.9/ 100
METRIC RATING
177th/ 347
METRIC RANK
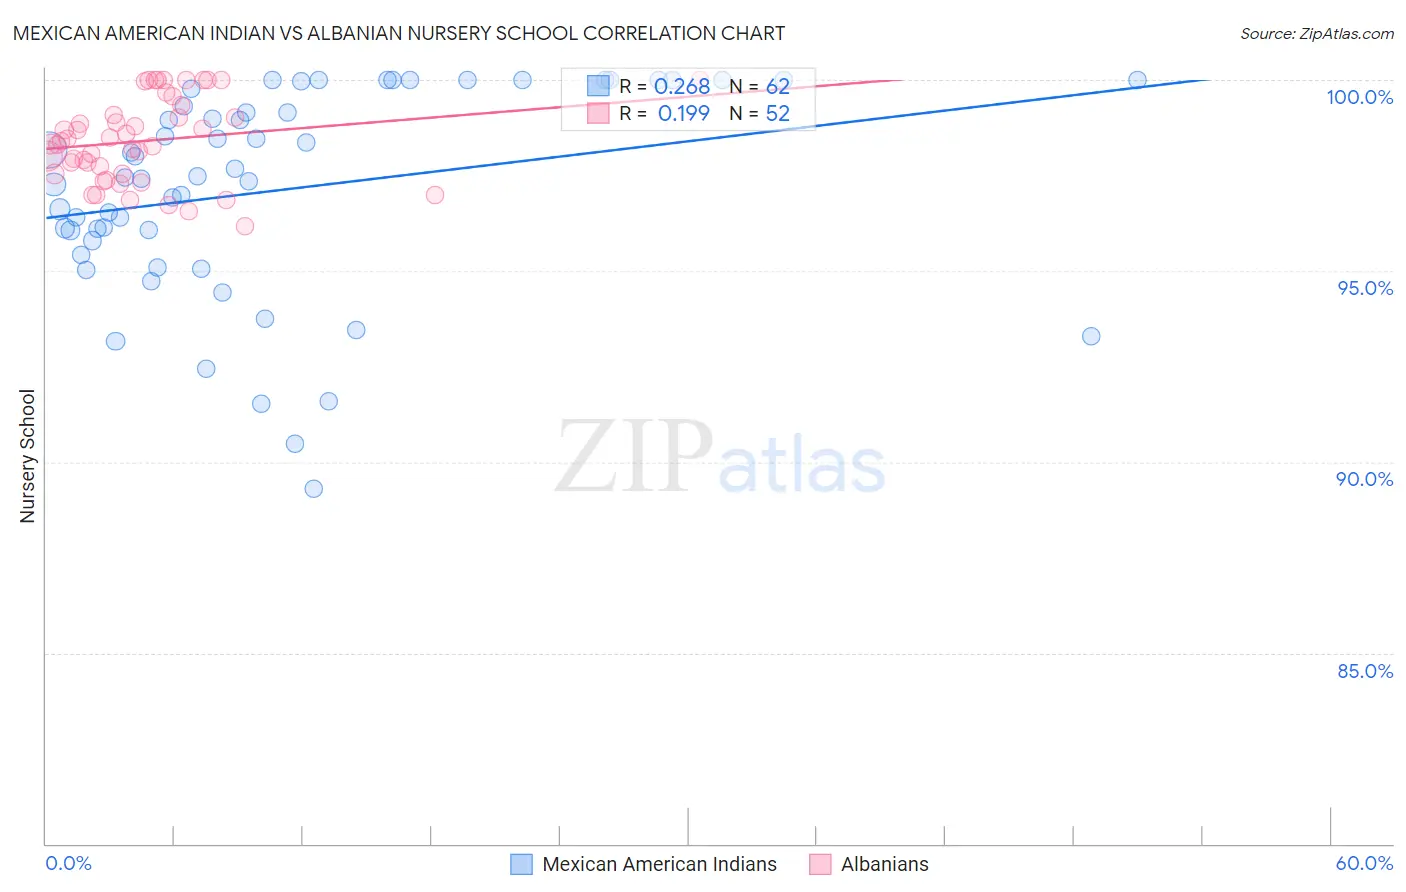
Mexican American Indian vs Albanian Nursery School Correlation Chart
The statistical analysis conducted on geographies consisting of 317,619,717 people shows a weak positive correlation between the proportion of Mexican American Indians and percentage of population with at least nursery school education in the United States with a correlation coefficient (R) of 0.268 and weighted average of 96.9%. Similarly, the statistical analysis conducted on geographies consisting of 193,265,850 people shows a poor positive correlation between the proportion of Albanians and percentage of population with at least nursery school education in the United States with a correlation coefficient (R) of 0.199 and weighted average of 98.0%, a difference of 1.2%.
Nursery School Correlation Summary
| Measurement | Mexican American Indian | Albanian |
| Minimum | 89.3% | 96.2% |
| Maximum | 100.0% | 100.0% |
| Range | 10.7% | 3.8% |
| Mean | 97.1% | 98.4% |
| Median | 97.5% | 98.4% |
| Interquartile 25% (IQ1) | 95.8% | 97.5% |
| Interquartile 75% (IQ3) | 99.8% | 99.2% |
| Interquartile Range (IQR) | 4.0% | 1.7% |
| Standard Deviation (Sample) | 2.7% | 1.1% |
| Standard Deviation (Population) | 2.7% | 1.1% |
Similar Demographics by Nursery School
Demographics Similar to Mexican American Indians by Nursery School
In terms of nursery school, the demographic groups most similar to Mexican American Indians are Immigrants from Honduras (96.9%, a difference of 0.0%), Immigrants from Laos (96.9%, a difference of 0.020%), Immigrants from Burma/Myanmar (96.9%, a difference of 0.020%), Immigrants from Bangladesh (96.9%, a difference of 0.020%), and Vietnamese (96.8%, a difference of 0.020%).
| Demographics | Rating | Rank | Nursery School |
| Immigrants | Nicaragua | 0.0 /100 | #315 | Tragic 96.9% |
| Immigrants | Belize | 0.0 /100 | #316 | Tragic 96.9% |
| Immigrants | Ecuador | 0.0 /100 | #317 | Tragic 96.9% |
| Immigrants | Guyana | 0.0 /100 | #318 | Tragic 96.9% |
| Immigrants | Laos | 0.0 /100 | #319 | Tragic 96.9% |
| Immigrants | Burma/Myanmar | 0.0 /100 | #320 | Tragic 96.9% |
| Immigrants | Bangladesh | 0.0 /100 | #321 | Tragic 96.9% |
| Mexican American Indians | 0.0 /100 | #322 | Tragic 96.9% |
| Immigrants | Honduras | 0.0 /100 | #323 | Tragic 96.9% |
| Vietnamese | 0.0 /100 | #324 | Tragic 96.8% |
| Dominicans | 0.0 /100 | #325 | Tragic 96.8% |
| Indonesians | 0.0 /100 | #326 | Tragic 96.8% |
| Mexicans | 0.0 /100 | #327 | Tragic 96.8% |
| Immigrants | Latin America | 0.0 /100 | #328 | Tragic 96.7% |
| Immigrants | Vietnam | 0.0 /100 | #329 | Tragic 96.7% |
Demographics Similar to Albanians by Nursery School
In terms of nursery school, the demographic groups most similar to Albanians are Kenyan (98.0%, a difference of 0.0%), Navajo (98.0%, a difference of 0.0%), Immigrants from Sri Lanka (98.0%, a difference of 0.0%), Immigrants from Venezuela (98.0%, a difference of 0.0%), and Native/Alaskan (98.0%, a difference of 0.0%).
| Demographics | Rating | Rank | Nursery School |
| Bermudans | 53.7 /100 | #170 | Average 98.0% |
| Immigrants | Jordan | 53.4 /100 | #171 | Average 98.0% |
| Immigrants | Brazil | 51.3 /100 | #172 | Average 98.0% |
| Kenyans | 50.2 /100 | #173 | Average 98.0% |
| Navajo | 50.0 /100 | #174 | Average 98.0% |
| Immigrants | Sri Lanka | 49.9 /100 | #175 | Average 98.0% |
| Immigrants | Venezuela | 49.8 /100 | #176 | Average 98.0% |
| Albanians | 48.9 /100 | #177 | Average 98.0% |
| Natives/Alaskans | 48.6 /100 | #178 | Average 98.0% |
| Argentineans | 46.8 /100 | #179 | Average 98.0% |
| Immigrants | Bosnia and Herzegovina | 45.6 /100 | #180 | Average 98.0% |
| Egyptians | 42.8 /100 | #181 | Average 98.0% |
| Paiute | 42.0 /100 | #182 | Average 98.0% |
| Portuguese | 41.8 /100 | #183 | Average 98.0% |
| Immigrants | Poland | 41.3 /100 | #184 | Average 98.0% |