Cuban vs Irish Nursery School
COMPARE
Cuban
Irish
Nursery School
Nursery School Comparison
Cubans
Irish
97.6%
NURSERY SCHOOL
0.4/ 100
METRIC RATING
261st/ 347
METRIC RANK
98.6%
NURSERY SCHOOL
100.0/ 100
METRIC RATING
19th/ 347
METRIC RANK
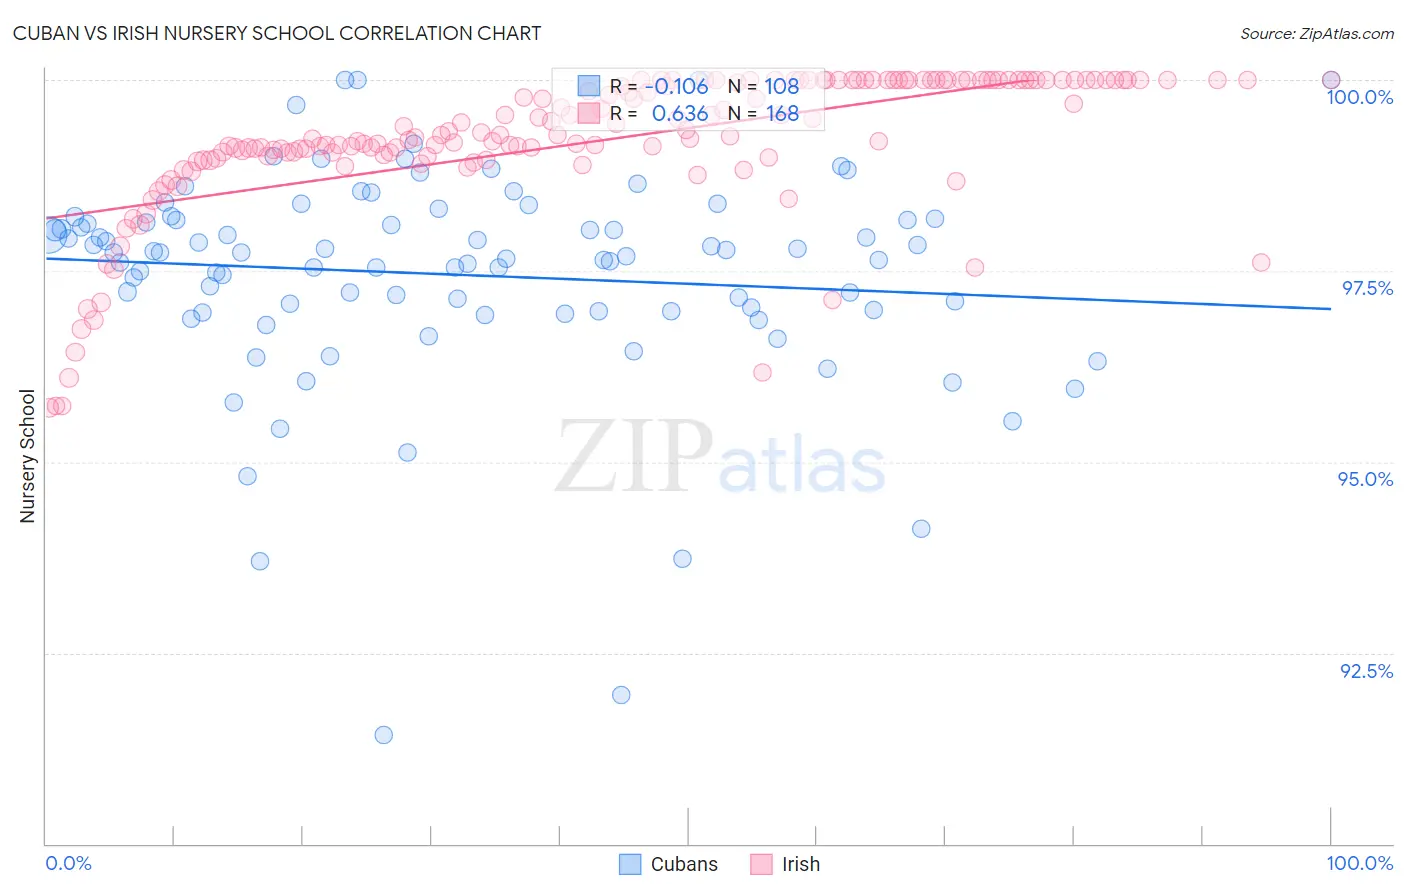
Cuban vs Irish Nursery School Correlation Chart
The statistical analysis conducted on geographies consisting of 449,326,865 people shows a poor negative correlation between the proportion of Cubans and percentage of population with at least nursery school education in the United States with a correlation coefficient (R) of -0.106 and weighted average of 97.6%. Similarly, the statistical analysis conducted on geographies consisting of 580,708,963 people shows a significant positive correlation between the proportion of Irish and percentage of population with at least nursery school education in the United States with a correlation coefficient (R) of 0.636 and weighted average of 98.6%, a difference of 1.1%.
Nursery School Correlation Summary
| Measurement | Cuban | Irish |
| Minimum | 91.4% | 95.7% |
| Maximum | 100.0% | 100.0% |
| Range | 8.6% | 4.3% |
| Mean | 97.5% | 99.2% |
| Median | 97.7% | 99.3% |
| Interquartile 25% (IQ1) | 97.0% | 99.0% |
| Interquartile 75% (IQ3) | 98.2% | 100.0% |
| Interquartile Range (IQR) | 1.2% | 1.00% |
| Standard Deviation (Sample) | 1.4% | 0.94% |
| Standard Deviation (Population) | 1.4% | 0.94% |
Similar Demographics by Nursery School
Demographics Similar to Cubans by Nursery School
In terms of nursery school, the demographic groups most similar to Cubans are Immigrants from South America (97.6%, a difference of 0.0%), Armenian (97.6%, a difference of 0.010%), Immigrants from Ethiopia (97.6%, a difference of 0.010%), Fijian (97.6%, a difference of 0.010%), and Taiwanese (97.6%, a difference of 0.010%).
| Demographics | Rating | Rank | Nursery School |
| Immigrants | Congo | 0.7 /100 | #254 | Tragic 97.6% |
| Immigrants | Asia | 0.7 /100 | #255 | Tragic 97.6% |
| Yaqui | 0.6 /100 | #256 | Tragic 97.6% |
| Immigrants | Colombia | 0.6 /100 | #257 | Tragic 97.6% |
| Jamaicans | 0.6 /100 | #258 | Tragic 97.6% |
| Armenians | 0.4 /100 | #259 | Tragic 97.6% |
| Immigrants | South America | 0.4 /100 | #260 | Tragic 97.6% |
| Cubans | 0.4 /100 | #261 | Tragic 97.6% |
| Immigrants | Ethiopia | 0.4 /100 | #262 | Tragic 97.6% |
| Fijians | 0.3 /100 | #263 | Tragic 97.6% |
| Taiwanese | 0.3 /100 | #264 | Tragic 97.6% |
| Assyrians/Chaldeans/Syriacs | 0.3 /100 | #265 | Tragic 97.6% |
| Immigrants | Sierra Leone | 0.3 /100 | #266 | Tragic 97.6% |
| Immigrants | Nigeria | 0.3 /100 | #267 | Tragic 97.5% |
| West Indians | 0.3 /100 | #268 | Tragic 97.5% |
Demographics Similar to Irish by Nursery School
In terms of nursery school, the demographic groups most similar to Irish are Pennsylvania German (98.6%, a difference of 0.010%), Finnish (98.6%, a difference of 0.010%), Lithuanian (98.6%, a difference of 0.010%), Polish (98.6%, a difference of 0.010%), and Danish (98.6%, a difference of 0.010%).
| Demographics | Rating | Rank | Nursery School |
| Slovenes | 100.0 /100 | #12 | Exceptional 98.7% |
| English | 100.0 /100 | #13 | Exceptional 98.7% |
| Carpatho Rusyns | 100.0 /100 | #14 | Exceptional 98.7% |
| Swedes | 100.0 /100 | #15 | Exceptional 98.7% |
| Scottish | 100.0 /100 | #16 | Exceptional 98.7% |
| Aleuts | 100.0 /100 | #17 | Exceptional 98.7% |
| Dutch | 100.0 /100 | #18 | Exceptional 98.7% |
| Irish | 100.0 /100 | #19 | Exceptional 98.6% |
| Pennsylvania Germans | 100.0 /100 | #20 | Exceptional 98.6% |
| Finns | 100.0 /100 | #21 | Exceptional 98.6% |
| Lithuanians | 100.0 /100 | #22 | Exceptional 98.6% |
| Poles | 100.0 /100 | #23 | Exceptional 98.6% |
| Danes | 100.0 /100 | #24 | Exceptional 98.6% |
| Scotch-Irish | 100.0 /100 | #25 | Exceptional 98.6% |
| Sioux | 100.0 /100 | #26 | Exceptional 98.6% |