French American Indian vs Albanian Nursery School
COMPARE
French American Indian
Albanian
Nursery School
Nursery School Comparison
French American Indians
Albanians
98.0%
NURSERY SCHOOL
62.1/ 100
METRIC RATING
159th/ 347
METRIC RANK
98.0%
NURSERY SCHOOL
48.9/ 100
METRIC RATING
177th/ 347
METRIC RANK
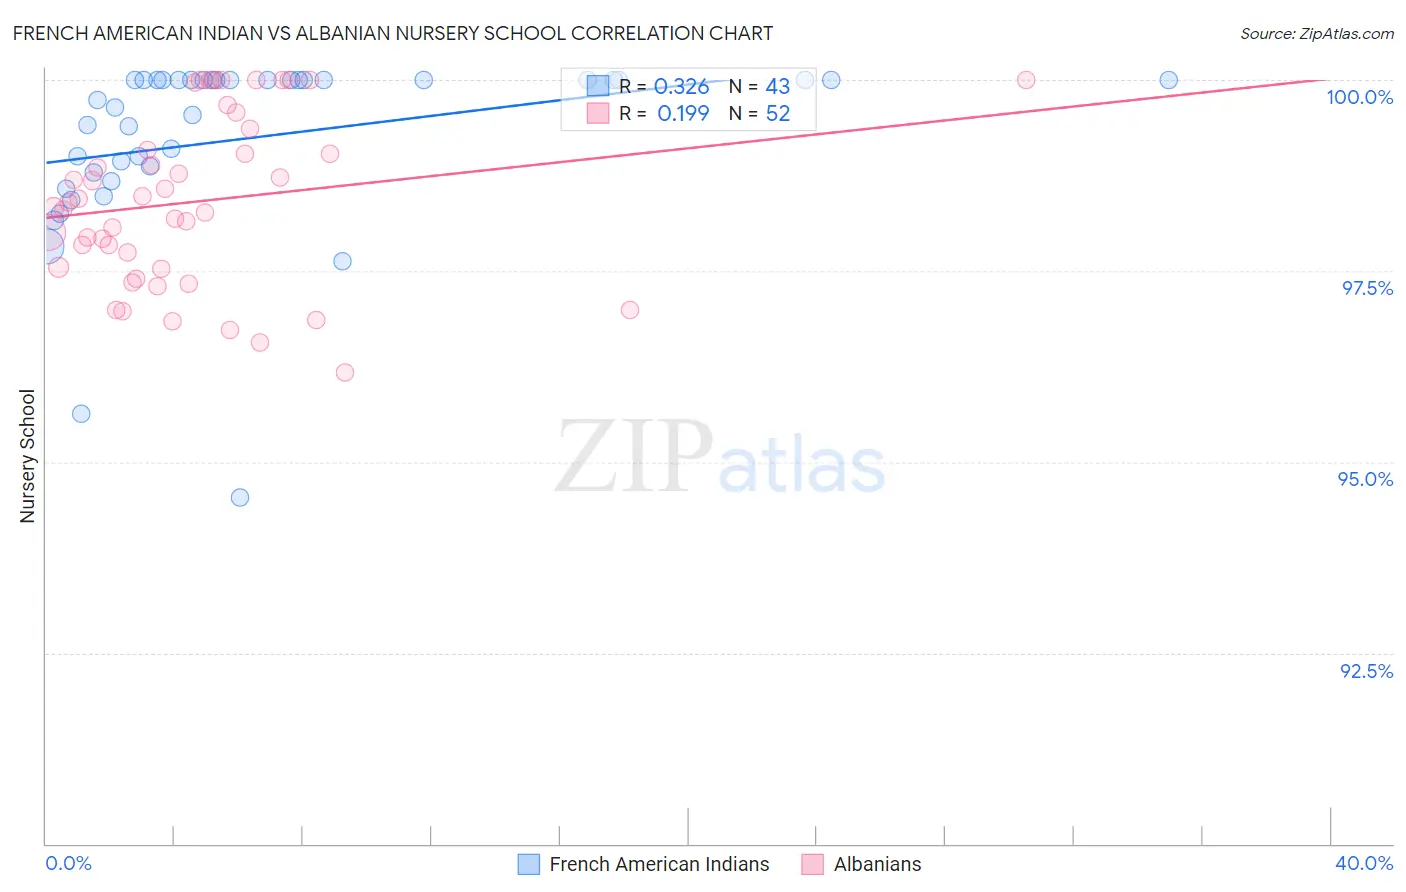
French American Indian vs Albanian Nursery School Correlation Chart
The statistical analysis conducted on geographies consisting of 131,974,854 people shows a mild positive correlation between the proportion of French American Indians and percentage of population with at least nursery school education in the United States with a correlation coefficient (R) of 0.326 and weighted average of 98.0%. Similarly, the statistical analysis conducted on geographies consisting of 193,265,850 people shows a poor positive correlation between the proportion of Albanians and percentage of population with at least nursery school education in the United States with a correlation coefficient (R) of 0.199 and weighted average of 98.0%, a difference of 0.040%.
Nursery School Correlation Summary
| Measurement | French American Indian | Albanian |
| Minimum | 94.5% | 96.2% |
| Maximum | 100.0% | 100.0% |
| Range | 5.5% | 3.8% |
| Mean | 99.2% | 98.4% |
| Median | 100.0% | 98.4% |
| Interquartile 25% (IQ1) | 98.8% | 97.5% |
| Interquartile 75% (IQ3) | 100.0% | 99.2% |
| Interquartile Range (IQR) | 1.2% | 1.7% |
| Standard Deviation (Sample) | 1.2% | 1.1% |
| Standard Deviation (Population) | 1.2% | 1.1% |
Demographics Similar to French American Indians and Albanians by Nursery School
In terms of nursery school, the demographic groups most similar to French American Indians are Immigrants from North Macedonia (98.0%, a difference of 0.010%), Immigrants from Russia (98.0%, a difference of 0.010%), Immigrants from Eastern Europe (98.0%, a difference of 0.010%), Brazilian (98.0%, a difference of 0.010%), and Immigrants from Italy (98.0%, a difference of 0.010%). Similarly, the demographic groups most similar to Albanians are Kenyan (98.0%, a difference of 0.0%), Navajo (98.0%, a difference of 0.0%), Immigrants from Sri Lanka (98.0%, a difference of 0.0%), Immigrants from Venezuela (98.0%, a difference of 0.0%), and Native/Alaskan (98.0%, a difference of 0.0%).
| Demographics | Rating | Rank | Nursery School |
| Immigrants | North Macedonia | 65.7 /100 | #158 | Good 98.0% |
| French American Indians | 62.1 /100 | #159 | Good 98.0% |
| Immigrants | Russia | 59.9 /100 | #160 | Average 98.0% |
| Immigrants | Eastern Europe | 59.7 /100 | #161 | Average 98.0% |
| Brazilians | 59.4 /100 | #162 | Average 98.0% |
| Immigrants | Italy | 59.0 /100 | #163 | Average 98.0% |
| Ugandans | 56.4 /100 | #164 | Average 98.0% |
| Chileans | 56.4 /100 | #165 | Average 98.0% |
| Spanish Americans | 55.6 /100 | #166 | Average 98.0% |
| Immigrants | Spain | 55.6 /100 | #167 | Average 98.0% |
| Immigrants | Micronesia | 55.0 /100 | #168 | Average 98.0% |
| Immigrants | Korea | 53.8 /100 | #169 | Average 98.0% |
| Bermudans | 53.7 /100 | #170 | Average 98.0% |
| Immigrants | Jordan | 53.4 /100 | #171 | Average 98.0% |
| Immigrants | Brazil | 51.3 /100 | #172 | Average 98.0% |
| Kenyans | 50.2 /100 | #173 | Average 98.0% |
| Navajo | 50.0 /100 | #174 | Average 98.0% |
| Immigrants | Sri Lanka | 49.9 /100 | #175 | Average 98.0% |
| Immigrants | Venezuela | 49.8 /100 | #176 | Average 98.0% |
| Albanians | 48.9 /100 | #177 | Average 98.0% |
| Natives/Alaskans | 48.6 /100 | #178 | Average 98.0% |