Mexican American Indian vs Albanian Unemployment
COMPARE
Mexican American Indian
Albanian
Unemployment
Unemployment Comparison
Mexican American Indians
Albanians
5.8%
UNEMPLOYMENT
0.1/ 100
METRIC RATING
266th/ 347
METRIC RANK
5.3%
UNEMPLOYMENT
43.5/ 100
METRIC RATING
181st/ 347
METRIC RANK
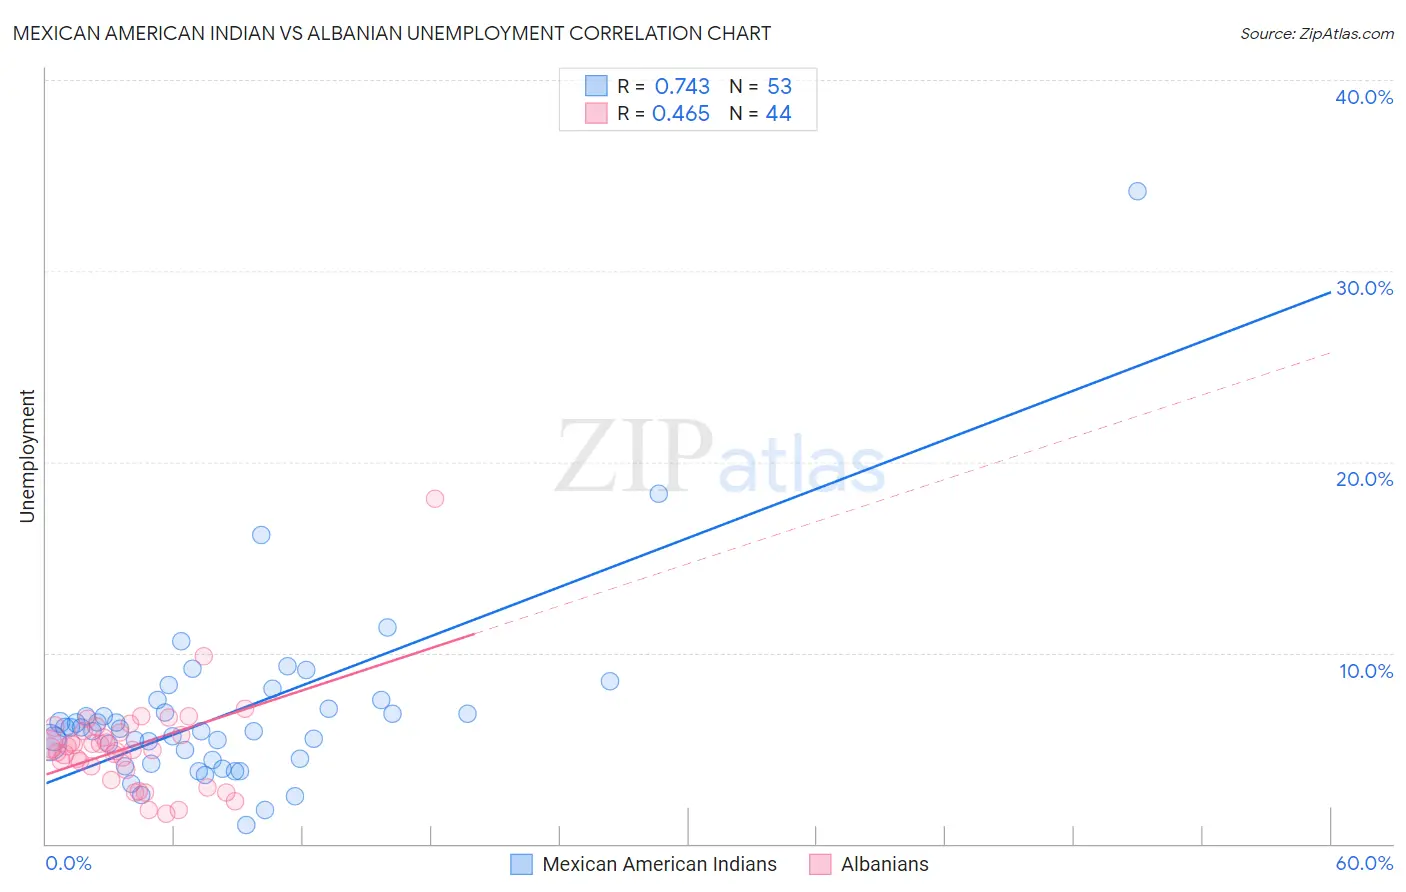
Mexican American Indian vs Albanian Unemployment Correlation Chart
The statistical analysis conducted on geographies consisting of 317,380,306 people shows a strong positive correlation between the proportion of Mexican American Indians and unemployment in the United States with a correlation coefficient (R) of 0.743 and weighted average of 5.8%. Similarly, the statistical analysis conducted on geographies consisting of 193,192,557 people shows a moderate positive correlation between the proportion of Albanians and unemployment in the United States with a correlation coefficient (R) of 0.465 and weighted average of 5.3%, a difference of 10.5%.
Unemployment Correlation Summary
| Measurement | Mexican American Indian | Albanian |
| Minimum | 1.0% | 1.6% |
| Maximum | 34.2% | 18.1% |
| Range | 33.2% | 16.5% |
| Mean | 6.8% | 5.1% |
| Median | 6.0% | 5.0% |
| Interquartile 25% (IQ1) | 4.4% | 3.9% |
| Interquartile 75% (IQ3) | 7.3% | 5.8% |
| Interquartile Range (IQR) | 2.9% | 1.9% |
| Standard Deviation (Sample) | 4.9% | 2.6% |
| Standard Deviation (Population) | 4.8% | 2.6% |
Similar Demographics by Unemployment
Demographics Similar to Mexican American Indians by Unemployment
In terms of unemployment, the demographic groups most similar to Mexican American Indians are Immigrants from Nigeria (5.8%, a difference of 0.070%), Immigrants from Sierra Leone (5.8%, a difference of 0.11%), Immigrants from El Salvador (5.8%, a difference of 0.12%), Blackfeet (5.8%, a difference of 0.20%), and Nigerian (5.8%, a difference of 0.40%).
| Demographics | Rating | Rank | Unemployment |
| Sub-Saharan Africans | 0.1 /100 | #259 | Tragic 5.8% |
| Immigrants | Uzbekistan | 0.1 /100 | #260 | Tragic 5.8% |
| Immigrants | Guatemala | 0.1 /100 | #261 | Tragic 5.8% |
| Sierra Leoneans | 0.1 /100 | #262 | Tragic 5.8% |
| Salvadorans | 0.1 /100 | #263 | Tragic 5.8% |
| Immigrants | Liberia | 0.1 /100 | #264 | Tragic 5.8% |
| Nigerians | 0.1 /100 | #265 | Tragic 5.8% |
| Mexican American Indians | 0.1 /100 | #266 | Tragic 5.8% |
| Immigrants | Nigeria | 0.1 /100 | #267 | Tragic 5.8% |
| Immigrants | Sierra Leone | 0.1 /100 | #268 | Tragic 5.8% |
| Immigrants | El Salvador | 0.1 /100 | #269 | Tragic 5.8% |
| Blackfeet | 0.1 /100 | #270 | Tragic 5.8% |
| Mexicans | 0.1 /100 | #271 | Tragic 5.9% |
| Hispanics or Latinos | 0.0 /100 | #272 | Tragic 5.9% |
| Immigrants | Fiji | 0.0 /100 | #273 | Tragic 5.9% |
Demographics Similar to Albanians by Unemployment
In terms of unemployment, the demographic groups most similar to Albanians are Spaniard (5.3%, a difference of 0.080%), Immigrants from Greece (5.3%, a difference of 0.090%), Malaysian (5.3%, a difference of 0.21%), Brazilian (5.3%, a difference of 0.21%), and Afghan (5.3%, a difference of 0.24%).
| Demographics | Rating | Rank | Unemployment |
| Immigrants | Congo | 50.0 /100 | #174 | Average 5.3% |
| Taiwanese | 49.6 /100 | #175 | Average 5.3% |
| Nicaraguans | 48.7 /100 | #176 | Average 5.3% |
| Immigrants | Nonimmigrants | 47.9 /100 | #177 | Average 5.3% |
| Afghans | 47.4 /100 | #178 | Average 5.3% |
| Malaysians | 46.8 /100 | #179 | Average 5.3% |
| Immigrants | Greece | 45.0 /100 | #180 | Average 5.3% |
| Albanians | 43.5 /100 | #181 | Average 5.3% |
| Spaniards | 42.2 /100 | #182 | Average 5.3% |
| Brazilians | 40.2 /100 | #183 | Average 5.3% |
| Assyrians/Chaldeans/Syriacs | 39.2 /100 | #184 | Fair 5.3% |
| Immigrants | Thailand | 38.9 /100 | #185 | Fair 5.3% |
| Immigrants | Uganda | 37.8 /100 | #186 | Fair 5.3% |
| Costa Ricans | 37.4 /100 | #187 | Fair 5.3% |
| Alsatians | 37.0 /100 | #188 | Fair 5.3% |