Cuban vs Delaware GED/Equivalency
COMPARE
Cuban
Delaware
GED/Equivalency
GED/Equivalency Comparison
Cubans
Delaware
82.0%
GED/EQUIVALENCY
0.0/ 100
METRIC RATING
291st/ 347
METRIC RANK
85.2%
GED/EQUIVALENCY
22.2/ 100
METRIC RATING
193rd/ 347
METRIC RANK
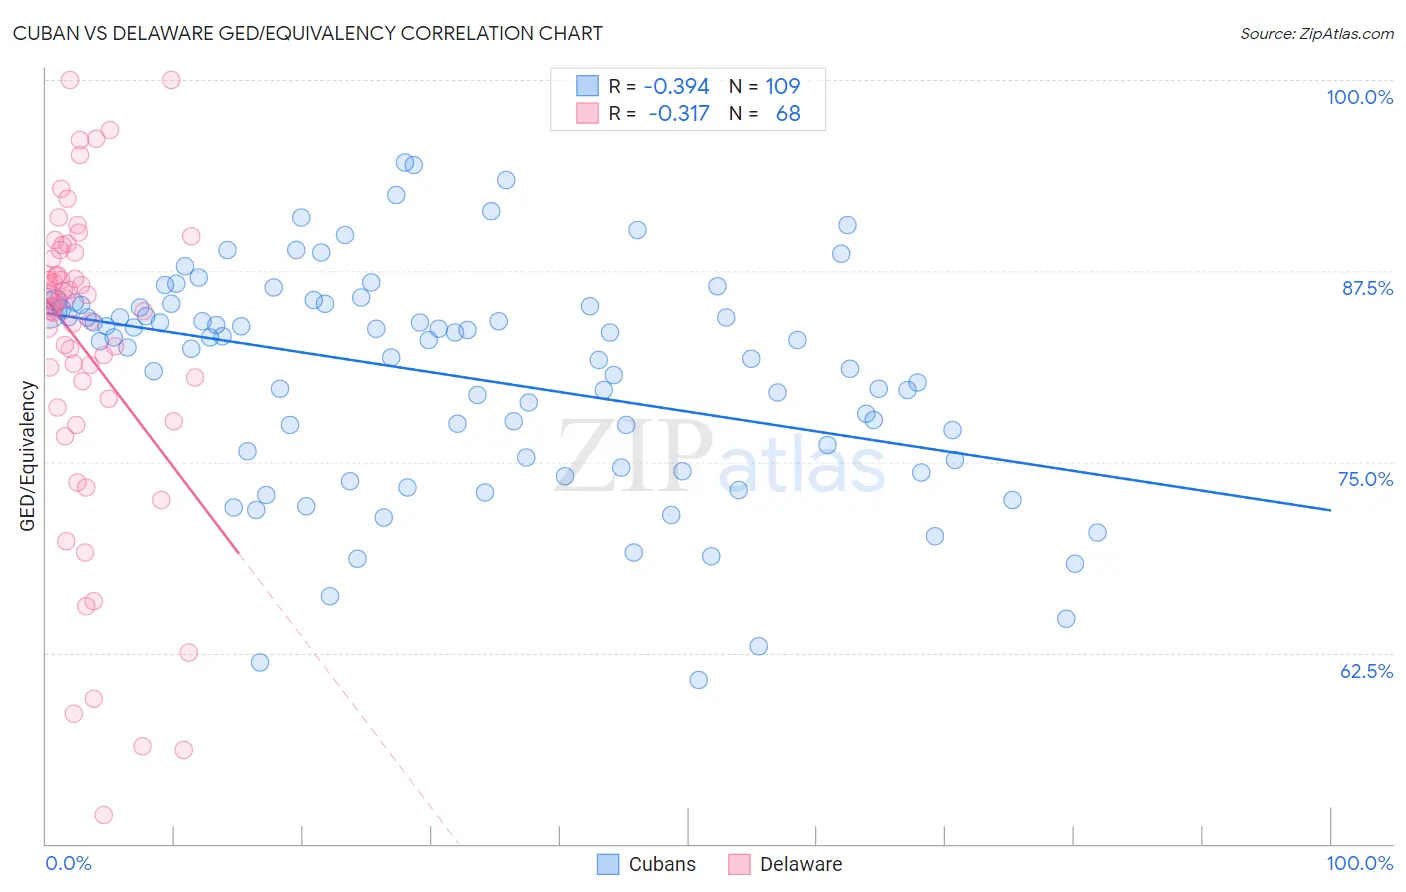
Cuban vs Delaware GED/Equivalency Correlation Chart
The statistical analysis conducted on geographies consisting of 449,373,028 people shows a mild negative correlation between the proportion of Cubans and percentage of population with at least ged/equivalency education in the United States with a correlation coefficient (R) of -0.394 and weighted average of 82.0%. Similarly, the statistical analysis conducted on geographies consisting of 96,235,398 people shows a mild negative correlation between the proportion of Delaware and percentage of population with at least ged/equivalency education in the United States with a correlation coefficient (R) of -0.317 and weighted average of 85.2%, a difference of 3.8%.
GED/Equivalency Correlation Summary
| Measurement | Cuban | Delaware |
| Minimum | 60.7% | 51.9% |
| Maximum | 94.6% | 100.0% |
| Range | 33.9% | 48.1% |
| Mean | 80.6% | 82.3% |
| Median | 82.9% | 85.2% |
| Interquartile 25% (IQ1) | 75.2% | 78.8% |
| Interquartile 75% (IQ3) | 85.2% | 88.5% |
| Interquartile Range (IQR) | 10.1% | 9.7% |
| Standard Deviation (Sample) | 7.2% | 10.5% |
| Standard Deviation (Population) | 7.2% | 10.5% |
Similar Demographics by GED/Equivalency
Demographics Similar to Cubans by GED/Equivalency
In terms of ged/equivalency, the demographic groups most similar to Cubans are Haitian (82.1%, a difference of 0.020%), Paiute (82.0%, a difference of 0.040%), British West Indian (82.0%, a difference of 0.040%), Immigrants from St. Vincent and the Grenadines (82.0%, a difference of 0.070%), and Nepalese (81.9%, a difference of 0.13%).
| Demographics | Rating | Rank | GED/Equivalency |
| Immigrants | Barbados | 0.1 /100 | #284 | Tragic 82.4% |
| Cajuns | 0.0 /100 | #285 | Tragic 82.4% |
| Immigrants | West Indies | 0.0 /100 | #286 | Tragic 82.4% |
| Japanese | 0.0 /100 | #287 | Tragic 82.4% |
| Pueblo | 0.0 /100 | #288 | Tragic 82.3% |
| Immigrants | Cambodia | 0.0 /100 | #289 | Tragic 82.2% |
| Haitians | 0.0 /100 | #290 | Tragic 82.1% |
| Cubans | 0.0 /100 | #291 | Tragic 82.0% |
| Paiute | 0.0 /100 | #292 | Tragic 82.0% |
| British West Indians | 0.0 /100 | #293 | Tragic 82.0% |
| Immigrants | St. Vincent and the Grenadines | 0.0 /100 | #294 | Tragic 82.0% |
| Nepalese | 0.0 /100 | #295 | Tragic 81.9% |
| Vietnamese | 0.0 /100 | #296 | Tragic 81.9% |
| Immigrants | Bangladesh | 0.0 /100 | #297 | Tragic 81.9% |
| Ute | 0.0 /100 | #298 | Tragic 81.8% |
Demographics Similar to Delaware by GED/Equivalency
In terms of ged/equivalency, the demographic groups most similar to Delaware are Nonimmigrants (85.2%, a difference of 0.010%), South American Indian (85.2%, a difference of 0.020%), Puget Sound Salish (85.2%, a difference of 0.040%), Chippewa (85.2%, a difference of 0.040%), and Tongan (85.2%, a difference of 0.050%).
| Demographics | Rating | Rank | GED/Equivalency |
| Spaniards | 31.9 /100 | #186 | Fair 85.4% |
| Immigrants | Afghanistan | 29.8 /100 | #187 | Fair 85.4% |
| Immigrants | Sierra Leone | 29.0 /100 | #188 | Fair 85.4% |
| Guamanians/Chamorros | 28.4 /100 | #189 | Fair 85.3% |
| Alaskan Athabascans | 27.5 /100 | #190 | Fair 85.3% |
| South American Indians | 22.8 /100 | #191 | Fair 85.2% |
| Immigrants | Nonimmigrants | 22.7 /100 | #192 | Fair 85.2% |
| Delaware | 22.2 /100 | #193 | Fair 85.2% |
| Puget Sound Salish | 20.8 /100 | #194 | Fair 85.2% |
| Chippewa | 20.8 /100 | #195 | Fair 85.2% |
| Tongans | 20.7 /100 | #196 | Fair 85.2% |
| Costa Ricans | 20.4 /100 | #197 | Fair 85.2% |
| Immigrants | Africa | 17.5 /100 | #198 | Poor 85.1% |
| Somalis | 16.4 /100 | #199 | Poor 85.0% |
| Uruguayans | 16.0 /100 | #200 | Poor 85.0% |