Yup'ik vs Jamaican Disability Age Under 5
COMPARE
Yup'ik
Jamaican
Disability Age Under 5
Disability Age Under 5 Comparison
Yup'ik
Jamaicans
4.5%
DISABILITY AGE UNDER 5
0.0/ 100
METRIC RATING
346th/ 347
METRIC RANK
1.3%
DISABILITY AGE UNDER 5
30.7/ 100
METRIC RATING
199th/ 347
METRIC RANK
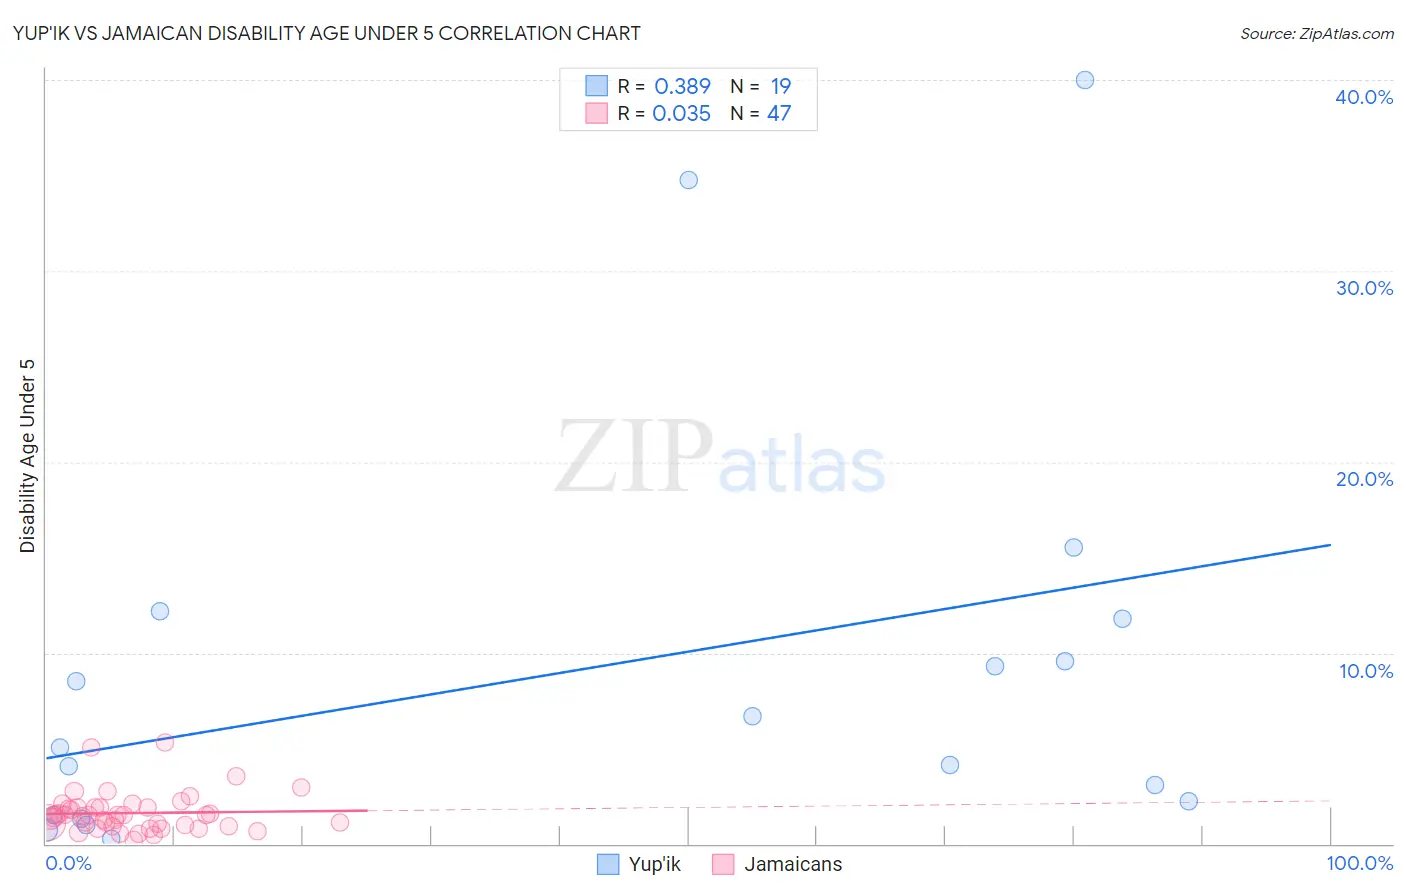
Yup'ik vs Jamaican Disability Age Under 5 Correlation Chart
The statistical analysis conducted on geographies consisting of 34,357,684 people shows a mild positive correlation between the proportion of Yup'ik and percentage of population with a disability under the age of 5 in the United States with a correlation coefficient (R) of 0.389 and weighted average of 4.5%. Similarly, the statistical analysis conducted on geographies consisting of 204,154,709 people shows no correlation between the proportion of Jamaicans and percentage of population with a disability under the age of 5 in the United States with a correlation coefficient (R) of 0.035 and weighted average of 1.3%, a difference of 258.3%.
Disability Age Under 5 Correlation Summary
| Measurement | Yup'ik | Jamaican |
| Minimum | 0.26% | 0.17% |
| Maximum | 40.0% | 5.3% |
| Range | 39.7% | 5.1% |
| Mean | 9.0% | 1.6% |
| Median | 5.1% | 1.5% |
| Interquartile 25% (IQ1) | 1.5% | 0.93% |
| Interquartile 75% (IQ3) | 11.8% | 1.9% |
| Interquartile Range (IQR) | 10.2% | 0.95% |
| Standard Deviation (Sample) | 11.0% | 1.0% |
| Standard Deviation (Population) | 10.7% | 1.0% |
Similar Demographics by Disability Age Under 5
Demographics Similar to Yup'ik by Disability Age Under 5
In terms of disability age under 5, the demographic groups most similar to Yup'ik are Hopi (4.6%, a difference of 2.3%), Paiute (3.9%, a difference of 15.8%), Inupiat (3.7%, a difference of 22.0%), Colville (3.3%, a difference of 37.8%), and Alaska Native (2.9%, a difference of 53.8%).
| Demographics | Rating | Rank | Disability Age Under 5 |
| Dutch West Indians | 0.0 /100 | #333 | Tragic 1.9% |
| Natives/Alaskans | 0.0 /100 | #334 | Tragic 1.9% |
| Pennsylvania Germans | 0.0 /100 | #335 | Tragic 1.9% |
| Paraguayans | 0.0 /100 | #336 | Tragic 2.0% |
| Apache | 0.0 /100 | #337 | Tragic 2.0% |
| Tohono O'odham | 0.0 /100 | #338 | Tragic 2.2% |
| Immigrants | Azores | 0.0 /100 | #339 | Tragic 2.2% |
| Menominee | 0.0 /100 | #340 | Tragic 2.3% |
| Tsimshian | 0.0 /100 | #341 | Tragic 2.4% |
| Alaska Natives | 0.0 /100 | #342 | Tragic 2.9% |
| Colville | 0.0 /100 | #343 | Tragic 3.3% |
| Inupiat | 0.0 /100 | #344 | Tragic 3.7% |
| Paiute | 0.0 /100 | #345 | Tragic 3.9% |
| Yup'ik | 0.0 /100 | #346 | Tragic 4.5% |
| Hopi | 0.0 /100 | #347 | Tragic 4.6% |
Demographics Similar to Jamaicans by Disability Age Under 5
In terms of disability age under 5, the demographic groups most similar to Jamaicans are Immigrants from Norway (1.3%, a difference of 0.040%), Immigrants from Somalia (1.3%, a difference of 0.070%), Immigrants from Belgium (1.3%, a difference of 0.080%), U.S. Virgin Islander (1.3%, a difference of 0.38%), and Immigrants from Lithuania (1.3%, a difference of 0.38%).
| Demographics | Rating | Rank | Disability Age Under 5 |
| Immigrants | Bosnia and Herzegovina | 36.5 /100 | #192 | Fair 1.3% |
| Immigrants | Sierra Leone | 36.5 /100 | #193 | Fair 1.3% |
| Immigrants | North Macedonia | 34.7 /100 | #194 | Fair 1.3% |
| U.S. Virgin Islanders | 34.4 /100 | #195 | Fair 1.3% |
| Immigrants | Belgium | 31.4 /100 | #196 | Fair 1.3% |
| Immigrants | Somalia | 31.3 /100 | #197 | Fair 1.3% |
| Immigrants | Norway | 31.1 /100 | #198 | Fair 1.3% |
| Jamaicans | 30.7 /100 | #199 | Fair 1.3% |
| Immigrants | Lithuania | 27.2 /100 | #200 | Fair 1.3% |
| Immigrants | Italy | 25.4 /100 | #201 | Fair 1.3% |
| Arapaho | 24.1 /100 | #202 | Fair 1.3% |
| Liberians | 24.0 /100 | #203 | Fair 1.3% |
| Immigrants | Europe | 23.6 /100 | #204 | Fair 1.3% |
| Romanians | 22.5 /100 | #205 | Fair 1.3% |
| Immigrants | Poland | 22.4 /100 | #206 | Fair 1.3% |