Yup'ik vs Immigrants from Philippines Disability Age Under 5
COMPARE
Yup'ik
Immigrants from Philippines
Disability Age Under 5
Disability Age Under 5 Comparison
Yup'ik
Immigrants from Philippines
4.5%
DISABILITY AGE UNDER 5
0.0/ 100
METRIC RATING
346th/ 347
METRIC RANK
1.2%
DISABILITY AGE UNDER 5
93.5/ 100
METRIC RATING
117th/ 347
METRIC RANK
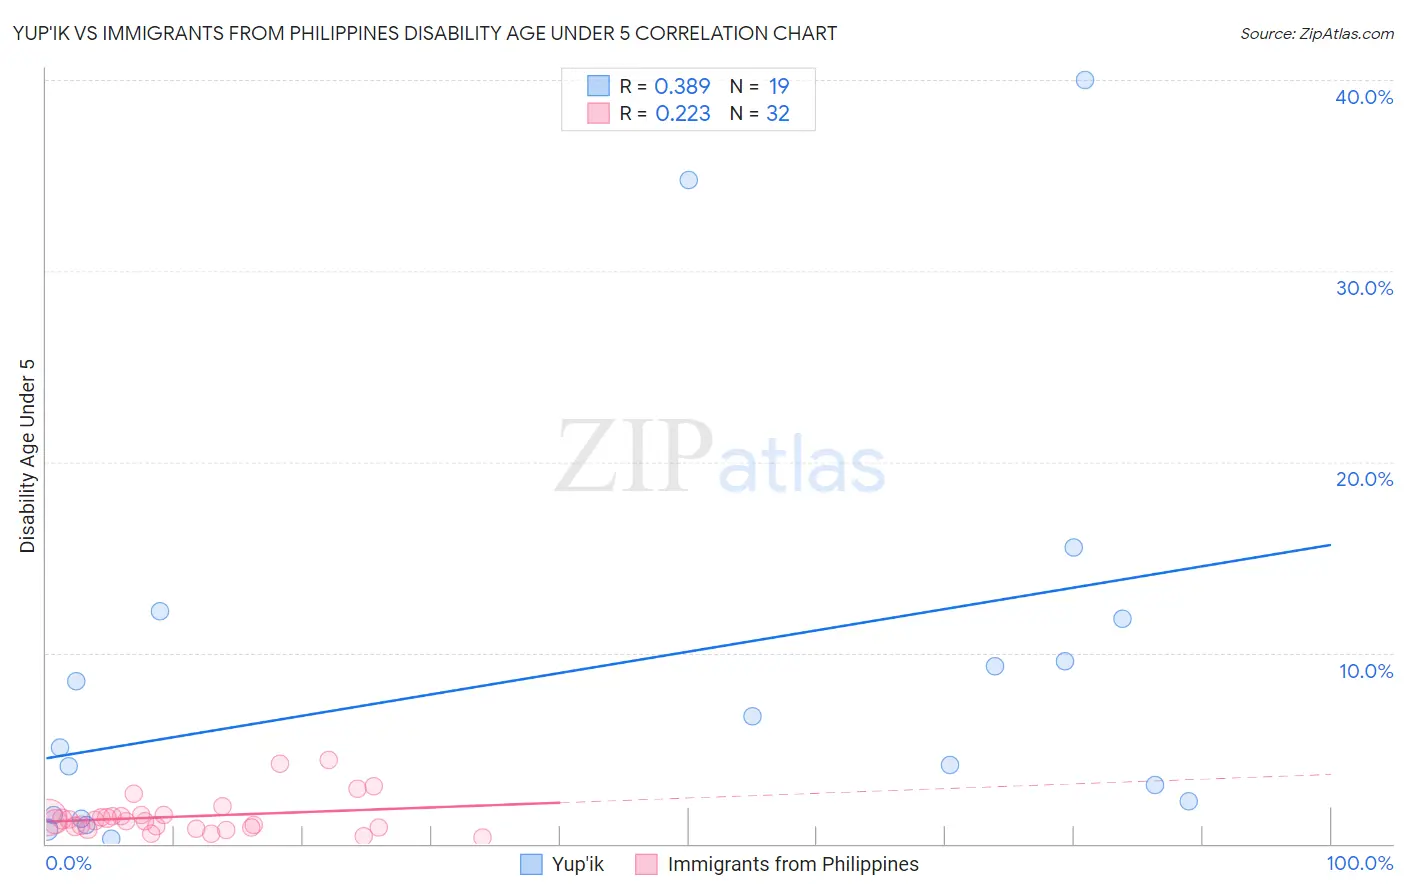
Yup'ik vs Immigrants from Philippines Disability Age Under 5 Correlation Chart
The statistical analysis conducted on geographies consisting of 34,357,684 people shows a mild positive correlation between the proportion of Yup'ik and percentage of population with a disability under the age of 5 in the United States with a correlation coefficient (R) of 0.389 and weighted average of 4.5%. Similarly, the statistical analysis conducted on geographies consisting of 241,635,312 people shows a weak positive correlation between the proportion of Immigrants from Philippines and percentage of population with a disability under the age of 5 in the United States with a correlation coefficient (R) of 0.223 and weighted average of 1.2%, a difference of 288.3%.
Disability Age Under 5 Correlation Summary
| Measurement | Yup'ik | Immigrants from Philippines |
| Minimum | 0.26% | 0.35% |
| Maximum | 40.0% | 4.4% |
| Range | 39.7% | 4.0% |
| Mean | 9.0% | 1.4% |
| Median | 5.1% | 1.2% |
| Interquartile 25% (IQ1) | 1.5% | 0.83% |
| Interquartile 75% (IQ3) | 11.8% | 1.5% |
| Interquartile Range (IQR) | 10.2% | 0.64% |
| Standard Deviation (Sample) | 11.0% | 0.99% |
| Standard Deviation (Population) | 10.7% | 0.97% |
Similar Demographics by Disability Age Under 5
Demographics Similar to Yup'ik by Disability Age Under 5
In terms of disability age under 5, the demographic groups most similar to Yup'ik are Hopi (4.6%, a difference of 2.3%), Paiute (3.9%, a difference of 15.8%), Inupiat (3.7%, a difference of 22.0%), Colville (3.3%, a difference of 37.8%), and Alaska Native (2.9%, a difference of 53.8%).
| Demographics | Rating | Rank | Disability Age Under 5 |
| Dutch West Indians | 0.0 /100 | #333 | Tragic 1.9% |
| Natives/Alaskans | 0.0 /100 | #334 | Tragic 1.9% |
| Pennsylvania Germans | 0.0 /100 | #335 | Tragic 1.9% |
| Paraguayans | 0.0 /100 | #336 | Tragic 2.0% |
| Apache | 0.0 /100 | #337 | Tragic 2.0% |
| Tohono O'odham | 0.0 /100 | #338 | Tragic 2.2% |
| Immigrants | Azores | 0.0 /100 | #339 | Tragic 2.2% |
| Menominee | 0.0 /100 | #340 | Tragic 2.3% |
| Tsimshian | 0.0 /100 | #341 | Tragic 2.4% |
| Alaska Natives | 0.0 /100 | #342 | Tragic 2.9% |
| Colville | 0.0 /100 | #343 | Tragic 3.3% |
| Inupiat | 0.0 /100 | #344 | Tragic 3.7% |
| Paiute | 0.0 /100 | #345 | Tragic 3.9% |
| Yup'ik | 0.0 /100 | #346 | Tragic 4.5% |
| Hopi | 0.0 /100 | #347 | Tragic 4.6% |
Demographics Similar to Immigrants from Philippines by Disability Age Under 5
In terms of disability age under 5, the demographic groups most similar to Immigrants from Philippines are Immigrants from Venezuela (1.2%, a difference of 0.030%), Immigrants from Northern Africa (1.2%, a difference of 0.13%), Immigrants from Caribbean (1.2%, a difference of 0.15%), Belizean (1.2%, a difference of 0.17%), and Immigrants from Oceania (1.2%, a difference of 0.31%).
| Demographics | Rating | Rank | Disability Age Under 5 |
| Immigrants | Lebanon | 95.0 /100 | #110 | Exceptional 1.2% |
| Senegalese | 94.6 /100 | #111 | Exceptional 1.2% |
| Immigrants | Australia | 94.4 /100 | #112 | Exceptional 1.2% |
| Immigrants | Oceania | 94.2 /100 | #113 | Exceptional 1.2% |
| Belizeans | 93.9 /100 | #114 | Exceptional 1.2% |
| Immigrants | Caribbean | 93.8 /100 | #115 | Exceptional 1.2% |
| Immigrants | Northern Africa | 93.8 /100 | #116 | Exceptional 1.2% |
| Immigrants | Philippines | 93.5 /100 | #117 | Exceptional 1.2% |
| Immigrants | Venezuela | 93.4 /100 | #118 | Exceptional 1.2% |
| Bhutanese | 92.5 /100 | #119 | Exceptional 1.2% |
| Immigrants | Eritrea | 92.3 /100 | #120 | Exceptional 1.2% |
| Immigrants | Senegal | 91.4 /100 | #121 | Exceptional 1.2% |
| Aleuts | 90.7 /100 | #122 | Exceptional 1.2% |
| Zimbabweans | 90.6 /100 | #123 | Exceptional 1.2% |
| Immigrants | Cambodia | 90.5 /100 | #124 | Exceptional 1.2% |