Yup'ik vs South African Disability Age Under 5
COMPARE
Yup'ik
South African
Disability Age Under 5
Disability Age Under 5 Comparison
Yup'ik
South Africans
4.5%
DISABILITY AGE UNDER 5
0.0/ 100
METRIC RATING
346th/ 347
METRIC RANK
1.1%
DISABILITY AGE UNDER 5
98.7/ 100
METRIC RATING
68th/ 347
METRIC RANK
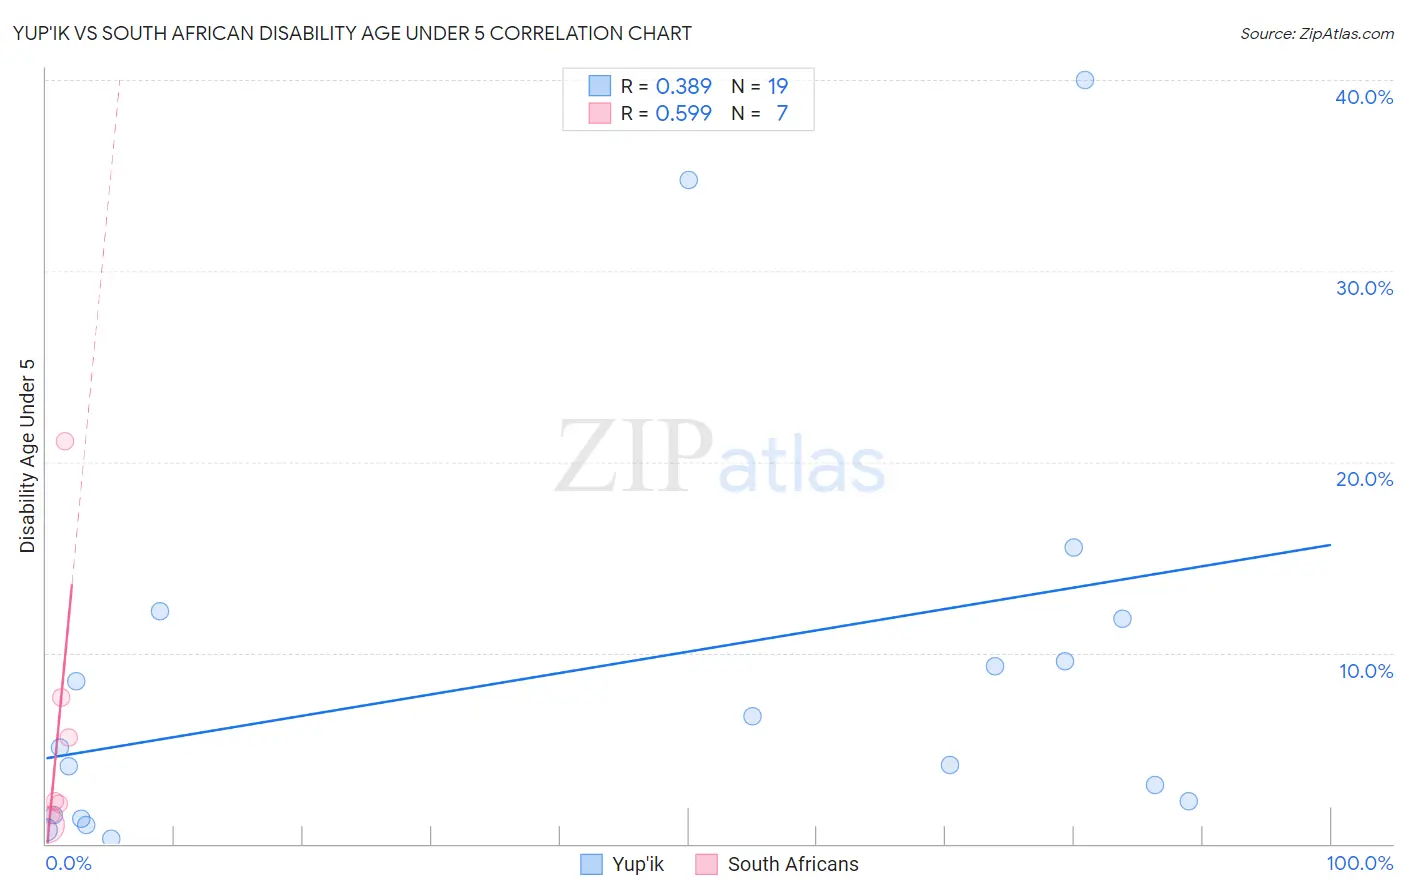
Yup'ik vs South African Disability Age Under 5 Correlation Chart
The statistical analysis conducted on geographies consisting of 34,357,684 people shows a mild positive correlation between the proportion of Yup'ik and percentage of population with a disability under the age of 5 in the United States with a correlation coefficient (R) of 0.389 and weighted average of 4.5%. Similarly, the statistical analysis conducted on geographies consisting of 120,529,150 people shows a substantial positive correlation between the proportion of South Africans and percentage of population with a disability under the age of 5 in the United States with a correlation coefficient (R) of 0.599 and weighted average of 1.1%, a difference of 304.4%.
Disability Age Under 5 Correlation Summary
| Measurement | Yup'ik | South African |
| Minimum | 0.26% | 0.96% |
| Maximum | 40.0% | 21.1% |
| Range | 39.7% | 20.1% |
| Mean | 9.0% | 5.9% |
| Median | 5.1% | 2.3% |
| Interquartile 25% (IQ1) | 1.5% | 1.5% |
| Interquartile 75% (IQ3) | 11.8% | 7.7% |
| Interquartile Range (IQR) | 10.2% | 6.1% |
| Standard Deviation (Sample) | 11.0% | 7.1% |
| Standard Deviation (Population) | 10.7% | 6.6% |
Similar Demographics by Disability Age Under 5
Demographics Similar to Yup'ik by Disability Age Under 5
In terms of disability age under 5, the demographic groups most similar to Yup'ik are Hopi (4.6%, a difference of 2.3%), Paiute (3.9%, a difference of 15.8%), Inupiat (3.7%, a difference of 22.0%), Colville (3.3%, a difference of 37.8%), and Alaska Native (2.9%, a difference of 53.8%).
| Demographics | Rating | Rank | Disability Age Under 5 |
| Dutch West Indians | 0.0 /100 | #333 | Tragic 1.9% |
| Natives/Alaskans | 0.0 /100 | #334 | Tragic 1.9% |
| Pennsylvania Germans | 0.0 /100 | #335 | Tragic 1.9% |
| Paraguayans | 0.0 /100 | #336 | Tragic 2.0% |
| Apache | 0.0 /100 | #337 | Tragic 2.0% |
| Tohono O'odham | 0.0 /100 | #338 | Tragic 2.2% |
| Immigrants | Azores | 0.0 /100 | #339 | Tragic 2.2% |
| Menominee | 0.0 /100 | #340 | Tragic 2.3% |
| Tsimshian | 0.0 /100 | #341 | Tragic 2.4% |
| Alaska Natives | 0.0 /100 | #342 | Tragic 2.9% |
| Colville | 0.0 /100 | #343 | Tragic 3.3% |
| Inupiat | 0.0 /100 | #344 | Tragic 3.7% |
| Paiute | 0.0 /100 | #345 | Tragic 3.9% |
| Yup'ik | 0.0 /100 | #346 | Tragic 4.5% |
| Hopi | 0.0 /100 | #347 | Tragic 4.6% |
Demographics Similar to South Africans by Disability Age Under 5
In terms of disability age under 5, the demographic groups most similar to South Africans are Israeli (1.1%, a difference of 0.030%), Immigrants from Belize (1.1%, a difference of 0.040%), Immigrants from Indonesia (1.1%, a difference of 0.10%), Immigrants from Ecuador (1.1%, a difference of 0.11%), and Trinidadian and Tobagonian (1.1%, a difference of 0.17%).
| Demographics | Rating | Rank | Disability Age Under 5 |
| Immigrants | Ethiopia | 99.2 /100 | #61 | Exceptional 1.1% |
| Immigrants | Switzerland | 99.2 /100 | #62 | Exceptional 1.1% |
| Immigrants | Vietnam | 99.1 /100 | #63 | Exceptional 1.1% |
| Egyptians | 98.9 /100 | #64 | Exceptional 1.1% |
| Immigrants | Korea | 98.8 /100 | #65 | Exceptional 1.1% |
| Immigrants | Indonesia | 98.7 /100 | #66 | Exceptional 1.1% |
| Immigrants | Belize | 98.7 /100 | #67 | Exceptional 1.1% |
| South Africans | 98.7 /100 | #68 | Exceptional 1.1% |
| Israelis | 98.7 /100 | #69 | Exceptional 1.1% |
| Immigrants | Ecuador | 98.6 /100 | #70 | Exceptional 1.1% |
| Trinidadians and Tobagonians | 98.6 /100 | #71 | Exceptional 1.1% |
| Burmese | 98.5 /100 | #72 | Exceptional 1.1% |
| Immigrants | Sri Lanka | 98.5 /100 | #73 | Exceptional 1.1% |
| Jordanians | 98.5 /100 | #74 | Exceptional 1.1% |
| Immigrants | Pakistan | 98.4 /100 | #75 | Exceptional 1.1% |