Inupiat vs Turkish Disability
COMPARE
Inupiat
Turkish
Disability
Disability Comparison
Inupiat
Turks
12.2%
DISABILITY
2.8/ 100
METRIC RATING
229th/ 347
METRIC RANK
10.7%
DISABILITY
100.0/ 100
METRIC RATING
37th/ 347
METRIC RANK
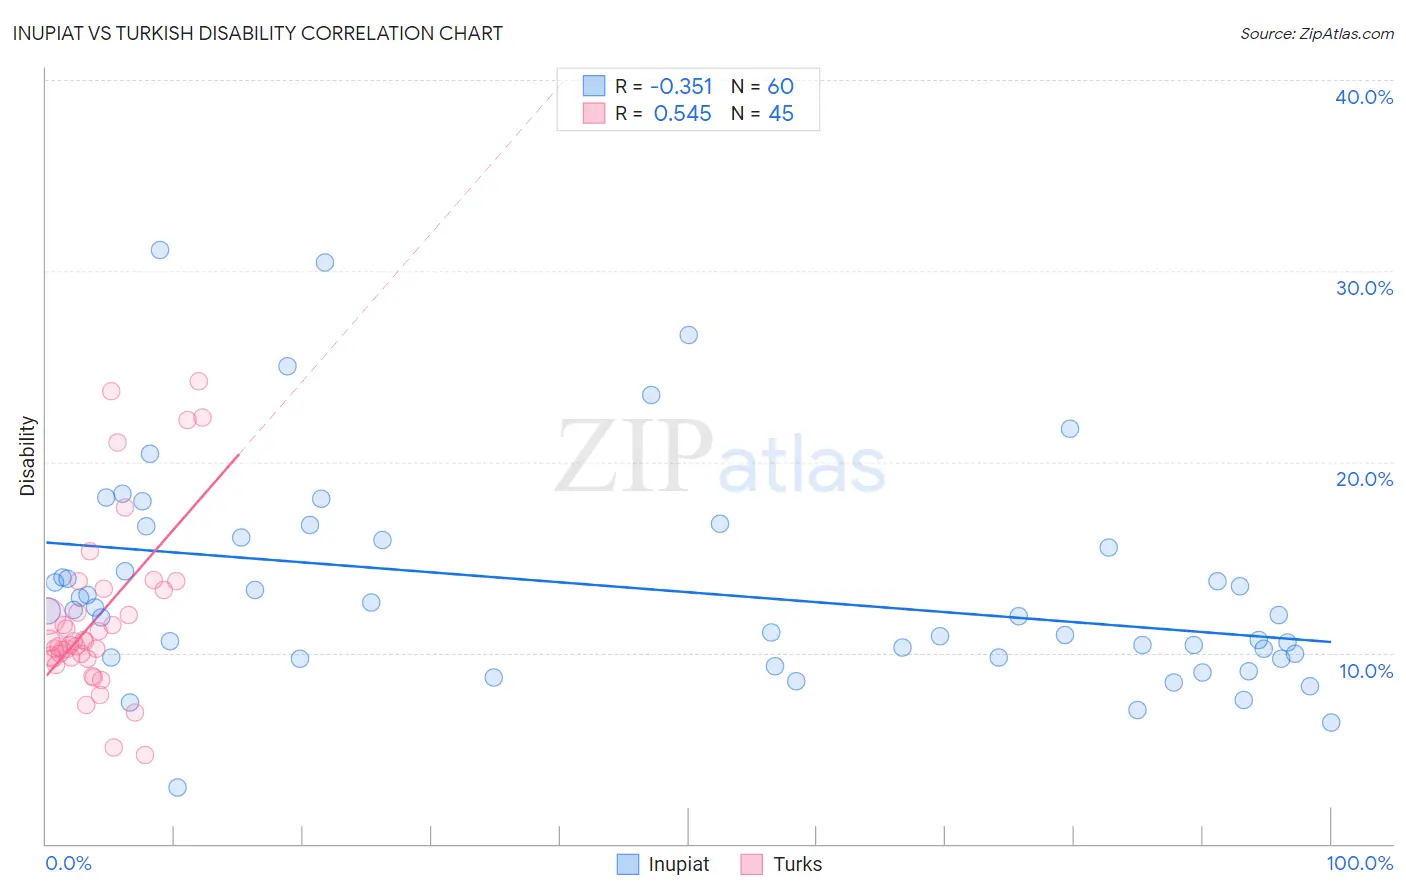
Inupiat vs Turkish Disability Correlation Chart
The statistical analysis conducted on geographies consisting of 96,338,624 people shows a mild negative correlation between the proportion of Inupiat and percentage of population with a disability in the United States with a correlation coefficient (R) of -0.351 and weighted average of 12.2%. Similarly, the statistical analysis conducted on geographies consisting of 271,857,414 people shows a substantial positive correlation between the proportion of Turks and percentage of population with a disability in the United States with a correlation coefficient (R) of 0.545 and weighted average of 10.7%, a difference of 13.5%.
Disability Correlation Summary
| Measurement | Inupiat | Turkish |
| Minimum | 2.9% | 4.7% |
| Maximum | 31.1% | 24.3% |
| Range | 28.2% | 19.6% |
| Mean | 13.4% | 11.9% |
| Median | 12.1% | 10.6% |
| Interquartile 25% (IQ1) | 9.8% | 9.7% |
| Interquartile 75% (IQ3) | 16.0% | 13.3% |
| Interquartile Range (IQR) | 6.2% | 3.6% |
| Standard Deviation (Sample) | 5.6% | 4.5% |
| Standard Deviation (Population) | 5.6% | 4.5% |
Similar Demographics by Disability
Demographics Similar to Inupiat by Disability
In terms of disability, the demographic groups most similar to Inupiat are West Indian (12.2%, a difference of 0.020%), Samoan (12.2%, a difference of 0.080%), Malaysian (12.2%, a difference of 0.11%), Italian (12.2%, a difference of 0.12%), and Alsatian (12.1%, a difference of 0.16%).
| Demographics | Rating | Rank | Disability |
| Spanish American Indians | 4.1 /100 | #222 | Tragic 12.1% |
| Hispanics or Latinos | 3.9 /100 | #223 | Tragic 12.1% |
| Mexicans | 3.7 /100 | #224 | Tragic 12.1% |
| Senegalese | 3.5 /100 | #225 | Tragic 12.1% |
| Jamaicans | 3.3 /100 | #226 | Tragic 12.1% |
| Alsatians | 3.3 /100 | #227 | Tragic 12.1% |
| West Indians | 2.9 /100 | #228 | Tragic 12.2% |
| Inupiat | 2.8 /100 | #229 | Tragic 12.2% |
| Samoans | 2.6 /100 | #230 | Tragic 12.2% |
| Malaysians | 2.5 /100 | #231 | Tragic 12.2% |
| Italians | 2.5 /100 | #232 | Tragic 12.2% |
| Bahamians | 2.3 /100 | #233 | Tragic 12.2% |
| Japanese | 2.3 /100 | #234 | Tragic 12.2% |
| Yup'ik | 2.2 /100 | #235 | Tragic 12.2% |
| Chinese | 2.0 /100 | #236 | Tragic 12.2% |
Demographics Similar to Turks by Disability
In terms of disability, the demographic groups most similar to Turks are Ethiopian (10.7%, a difference of 0.010%), Immigrants from Indonesia (10.7%, a difference of 0.070%), Immigrants from Ethiopia (10.7%, a difference of 0.080%), Immigrants from Kuwait (10.7%, a difference of 0.30%), and Afghan (10.8%, a difference of 0.44%).
| Demographics | Rating | Rank | Disability |
| Immigrants | Turkey | 100.0 /100 | #30 | Exceptional 10.6% |
| Immigrants | Egypt | 100.0 /100 | #31 | Exceptional 10.6% |
| Paraguayans | 100.0 /100 | #32 | Exceptional 10.6% |
| Immigrants | Kuwait | 100.0 /100 | #33 | Exceptional 10.7% |
| Immigrants | Ethiopia | 100.0 /100 | #34 | Exceptional 10.7% |
| Immigrants | Indonesia | 100.0 /100 | #35 | Exceptional 10.7% |
| Ethiopians | 100.0 /100 | #36 | Exceptional 10.7% |
| Turks | 100.0 /100 | #37 | Exceptional 10.7% |
| Afghans | 99.9 /100 | #38 | Exceptional 10.8% |
| Cambodians | 99.9 /100 | #39 | Exceptional 10.8% |
| Mongolians | 99.9 /100 | #40 | Exceptional 10.8% |
| Immigrants | Australia | 99.9 /100 | #41 | Exceptional 10.8% |
| Immigrants | Nepal | 99.9 /100 | #42 | Exceptional 10.8% |
| Israelis | 99.9 /100 | #43 | Exceptional 10.8% |
| Immigrants | Japan | 99.9 /100 | #44 | Exceptional 10.8% |