Immigrants from Taiwan vs Turkish Disability
COMPARE
Immigrants from Taiwan
Turkish
Disability
Disability Comparison
Immigrants from Taiwan
Turks
9.6%
DISABILITY
100.0/ 100
METRIC RATING
3rd/ 347
METRIC RANK
10.7%
DISABILITY
100.0/ 100
METRIC RATING
37th/ 347
METRIC RANK
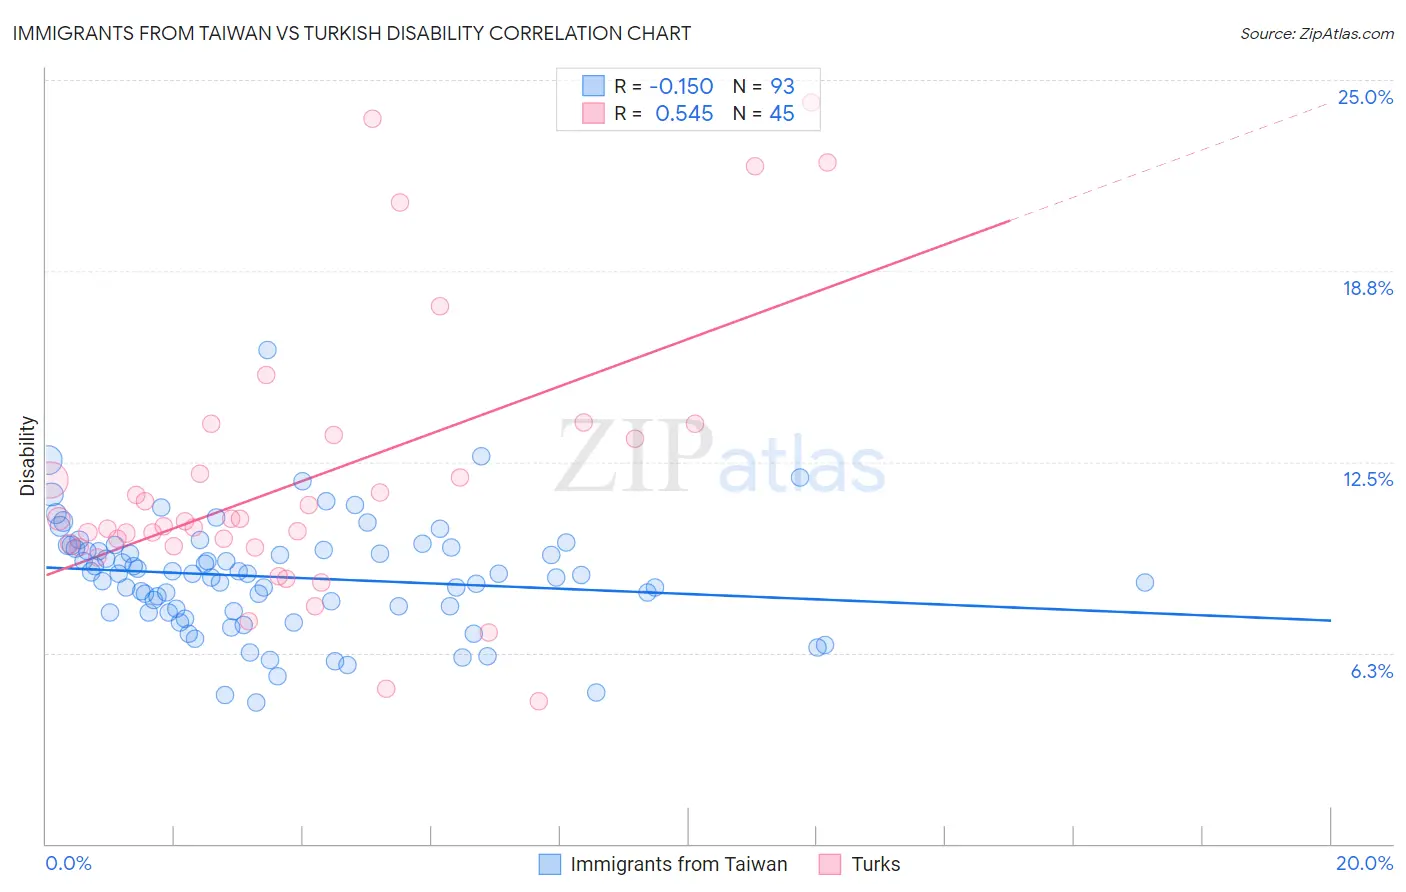
Immigrants from Taiwan vs Turkish Disability Correlation Chart
The statistical analysis conducted on geographies consisting of 298,248,980 people shows a poor negative correlation between the proportion of Immigrants from Taiwan and percentage of population with a disability in the United States with a correlation coefficient (R) of -0.150 and weighted average of 9.6%. Similarly, the statistical analysis conducted on geographies consisting of 271,857,414 people shows a substantial positive correlation between the proportion of Turks and percentage of population with a disability in the United States with a correlation coefficient (R) of 0.545 and weighted average of 10.7%, a difference of 11.5%.
Disability Correlation Summary
| Measurement | Immigrants from Taiwan | Turkish |
| Minimum | 4.6% | 4.7% |
| Maximum | 16.2% | 24.3% |
| Range | 11.5% | 19.6% |
| Mean | 8.7% | 11.9% |
| Median | 8.8% | 10.6% |
| Interquartile 25% (IQ1) | 7.6% | 9.7% |
| Interquartile 75% (IQ3) | 9.7% | 13.3% |
| Interquartile Range (IQR) | 2.1% | 3.6% |
| Standard Deviation (Sample) | 1.8% | 4.5% |
| Standard Deviation (Population) | 1.8% | 4.5% |
Similar Demographics by Disability
Demographics Similar to Immigrants from Taiwan by Disability
In terms of disability, the demographic groups most similar to Immigrants from Taiwan are Filipino (9.6%, a difference of 0.080%), Immigrants from India (9.5%, a difference of 1.1%), Thai (9.7%, a difference of 1.1%), Immigrants from Bolivia (9.9%, a difference of 2.7%), and Immigrants from South Central Asia (9.9%, a difference of 3.6%).
| Demographics | Rating | Rank | Disability |
| Immigrants | India | 100.0 /100 | #1 | Exceptional 9.5% |
| Filipinos | 100.0 /100 | #2 | Exceptional 9.6% |
| Immigrants | Taiwan | 100.0 /100 | #3 | Exceptional 9.6% |
| Thais | 100.0 /100 | #4 | Exceptional 9.7% |
| Immigrants | Bolivia | 100.0 /100 | #5 | Exceptional 9.9% |
| Immigrants | South Central Asia | 100.0 /100 | #6 | Exceptional 9.9% |
| Immigrants | Singapore | 100.0 /100 | #7 | Exceptional 10.0% |
| Bolivians | 100.0 /100 | #8 | Exceptional 10.0% |
| Immigrants | Hong Kong | 100.0 /100 | #9 | Exceptional 10.0% |
| Immigrants | China | 100.0 /100 | #10 | Exceptional 10.1% |
| Iranians | 100.0 /100 | #11 | Exceptional 10.1% |
| Immigrants | Israel | 100.0 /100 | #12 | Exceptional 10.1% |
| Immigrants | Eastern Asia | 100.0 /100 | #13 | Exceptional 10.2% |
| Immigrants | Korea | 100.0 /100 | #14 | Exceptional 10.2% |
| Okinawans | 100.0 /100 | #15 | Exceptional 10.3% |
Demographics Similar to Turks by Disability
In terms of disability, the demographic groups most similar to Turks are Ethiopian (10.7%, a difference of 0.010%), Immigrants from Indonesia (10.7%, a difference of 0.070%), Immigrants from Ethiopia (10.7%, a difference of 0.080%), Immigrants from Kuwait (10.7%, a difference of 0.30%), and Afghan (10.8%, a difference of 0.44%).
| Demographics | Rating | Rank | Disability |
| Immigrants | Turkey | 100.0 /100 | #30 | Exceptional 10.6% |
| Immigrants | Egypt | 100.0 /100 | #31 | Exceptional 10.6% |
| Paraguayans | 100.0 /100 | #32 | Exceptional 10.6% |
| Immigrants | Kuwait | 100.0 /100 | #33 | Exceptional 10.7% |
| Immigrants | Ethiopia | 100.0 /100 | #34 | Exceptional 10.7% |
| Immigrants | Indonesia | 100.0 /100 | #35 | Exceptional 10.7% |
| Ethiopians | 100.0 /100 | #36 | Exceptional 10.7% |
| Turks | 100.0 /100 | #37 | Exceptional 10.7% |
| Afghans | 99.9 /100 | #38 | Exceptional 10.8% |
| Cambodians | 99.9 /100 | #39 | Exceptional 10.8% |
| Mongolians | 99.9 /100 | #40 | Exceptional 10.8% |
| Immigrants | Australia | 99.9 /100 | #41 | Exceptional 10.8% |
| Immigrants | Nepal | 99.9 /100 | #42 | Exceptional 10.8% |
| Israelis | 99.9 /100 | #43 | Exceptional 10.8% |
| Immigrants | Japan | 99.9 /100 | #44 | Exceptional 10.8% |