Yugoslavian vs Cypriot Male Disability
COMPARE
Yugoslavian
Cypriot
Male Disability
Male Disability Comparison
Yugoslavians
Cypriots
11.9%
MALE DISABILITY
1.2/ 100
METRIC RATING
238th/ 347
METRIC RANK
10.0%
MALE DISABILITY
100.0/ 100
METRIC RATING
23rd/ 347
METRIC RANK
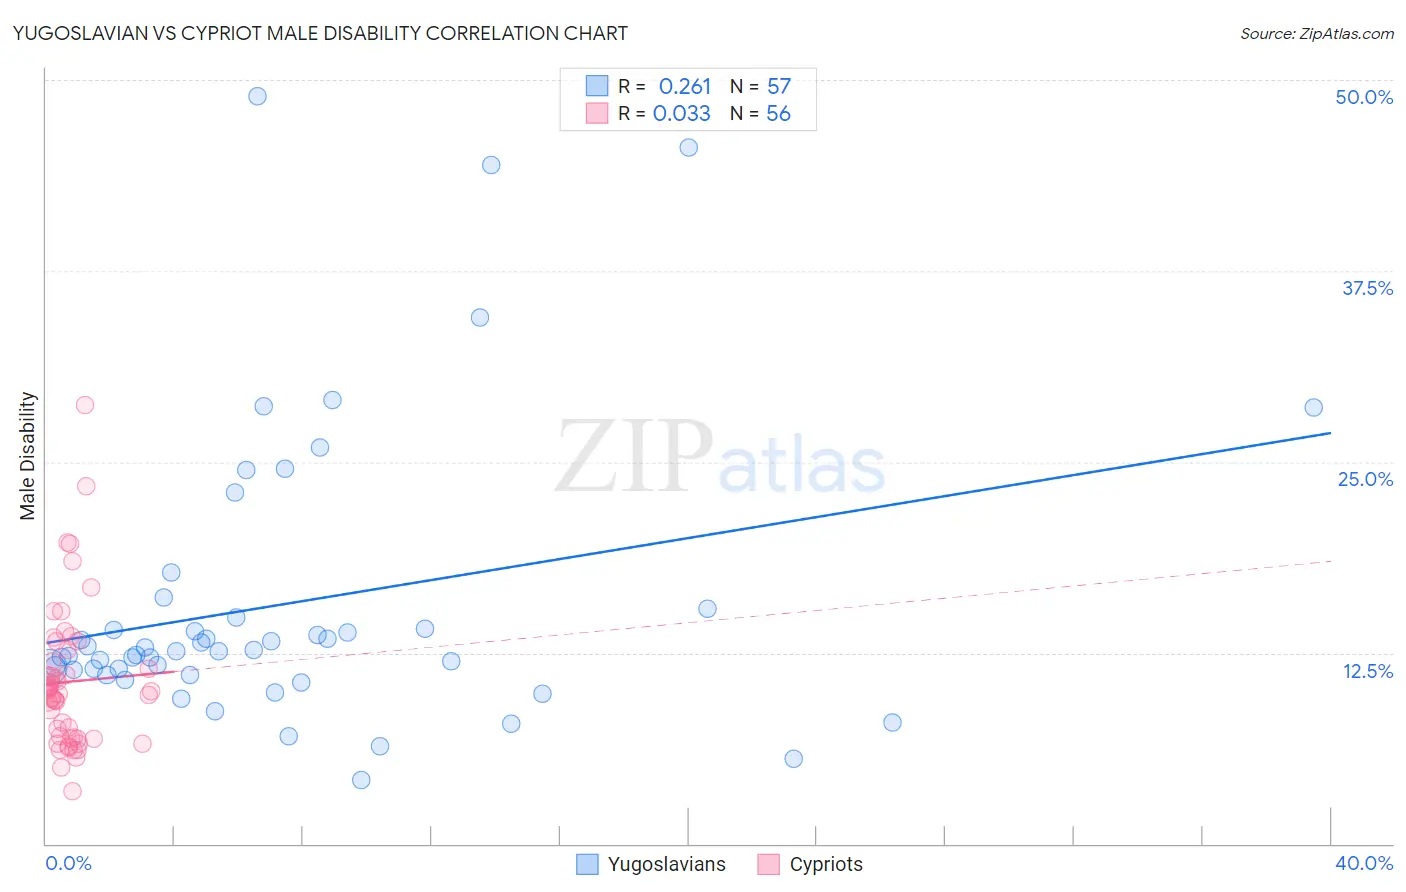
Yugoslavian vs Cypriot Male Disability Correlation Chart
The statistical analysis conducted on geographies consisting of 285,684,891 people shows a weak positive correlation between the proportion of Yugoslavians and percentage of males with a disability in the United States with a correlation coefficient (R) of 0.261 and weighted average of 11.9%. Similarly, the statistical analysis conducted on geographies consisting of 61,868,977 people shows no correlation between the proportion of Cypriots and percentage of males with a disability in the United States with a correlation coefficient (R) of 0.033 and weighted average of 10.0%, a difference of 18.8%.
Male Disability Correlation Summary
| Measurement | Yugoslavian | Cypriot |
| Minimum | 4.2% | 3.4% |
| Maximum | 48.9% | 28.7% |
| Range | 44.8% | 25.3% |
| Mean | 15.7% | 10.6% |
| Median | 12.6% | 9.9% |
| Interquartile 25% (IQ1) | 11.2% | 6.9% |
| Interquartile 75% (IQ3) | 15.1% | 12.3% |
| Interquartile Range (IQR) | 3.9% | 5.4% |
| Standard Deviation (Sample) | 9.5% | 4.7% |
| Standard Deviation (Population) | 9.4% | 4.6% |
Similar Demographics by Male Disability
Demographics Similar to Yugoslavians by Male Disability
In terms of male disability, the demographic groups most similar to Yugoslavians are Italian (11.9%, a difference of 0.050%), Carpatho Rusyn (11.9%, a difference of 0.10%), Czech (11.9%, a difference of 0.10%), U.S. Virgin Islander (11.9%, a difference of 0.11%), and Bahamian (11.9%, a difference of 0.14%).
| Demographics | Rating | Rank | Male Disability |
| Dominicans | 1.8 /100 | #231 | Tragic 11.8% |
| Malaysians | 1.8 /100 | #232 | Tragic 11.8% |
| Mexicans | 1.7 /100 | #233 | Tragic 11.8% |
| Immigrants | Canada | 1.6 /100 | #234 | Tragic 11.9% |
| Immigrants | North America | 1.5 /100 | #235 | Tragic 11.9% |
| U.S. Virgin Islanders | 1.3 /100 | #236 | Tragic 11.9% |
| Carpatho Rusyns | 1.3 /100 | #237 | Tragic 11.9% |
| Yugoslavians | 1.2 /100 | #238 | Tragic 11.9% |
| Italians | 1.2 /100 | #239 | Tragic 11.9% |
| Czechs | 1.1 /100 | #240 | Tragic 11.9% |
| Bahamians | 1.1 /100 | #241 | Tragic 11.9% |
| Northern Europeans | 1.1 /100 | #242 | Tragic 11.9% |
| Samoans | 1.1 /100 | #243 | Tragic 11.9% |
| Immigrants | Laos | 1.0 /100 | #244 | Tragic 11.9% |
| Immigrants | Liberia | 1.0 /100 | #245 | Tragic 11.9% |
Demographics Similar to Cypriots by Male Disability
In terms of male disability, the demographic groups most similar to Cypriots are Immigrants from Venezuela (10.0%, a difference of 0.090%), Immigrants from Asia (10.0%, a difference of 0.14%), Immigrants from Malaysia (10.0%, a difference of 0.32%), Burmese (10.0%, a difference of 0.38%), and Paraguayan (10.1%, a difference of 0.45%).
| Demographics | Rating | Rank | Male Disability |
| Okinawans | 100.0 /100 | #16 | Exceptional 9.8% |
| Immigrants | Korea | 100.0 /100 | #17 | Exceptional 9.8% |
| Immigrants | Pakistan | 100.0 /100 | #18 | Exceptional 9.8% |
| Immigrants | Sri Lanka | 100.0 /100 | #19 | Exceptional 10.0% |
| Asians | 100.0 /100 | #20 | Exceptional 10.0% |
| Burmese | 100.0 /100 | #21 | Exceptional 10.0% |
| Immigrants | Venezuela | 100.0 /100 | #22 | Exceptional 10.0% |
| Cypriots | 100.0 /100 | #23 | Exceptional 10.0% |
| Immigrants | Asia | 100.0 /100 | #24 | Exceptional 10.0% |
| Immigrants | Malaysia | 99.9 /100 | #25 | Exceptional 10.0% |
| Paraguayans | 99.9 /100 | #26 | Exceptional 10.1% |
| Egyptians | 99.9 /100 | #27 | Exceptional 10.1% |
| Vietnamese | 99.9 /100 | #28 | Exceptional 10.1% |
| Venezuelans | 99.9 /100 | #29 | Exceptional 10.1% |
| Immigrants | Egypt | 99.9 /100 | #30 | Exceptional 10.1% |