Yugoslavian vs Immigrants from the Azores Male Disability
COMPARE
Yugoslavian
Immigrants from the Azores
Male Disability
Male Disability Comparison
Yugoslavians
Immigrants from the Azores
11.9%
MALE DISABILITY
1.2/ 100
METRIC RATING
238th/ 347
METRIC RANK
13.4%
MALE DISABILITY
0.0/ 100
METRIC RATING
310th/ 347
METRIC RANK
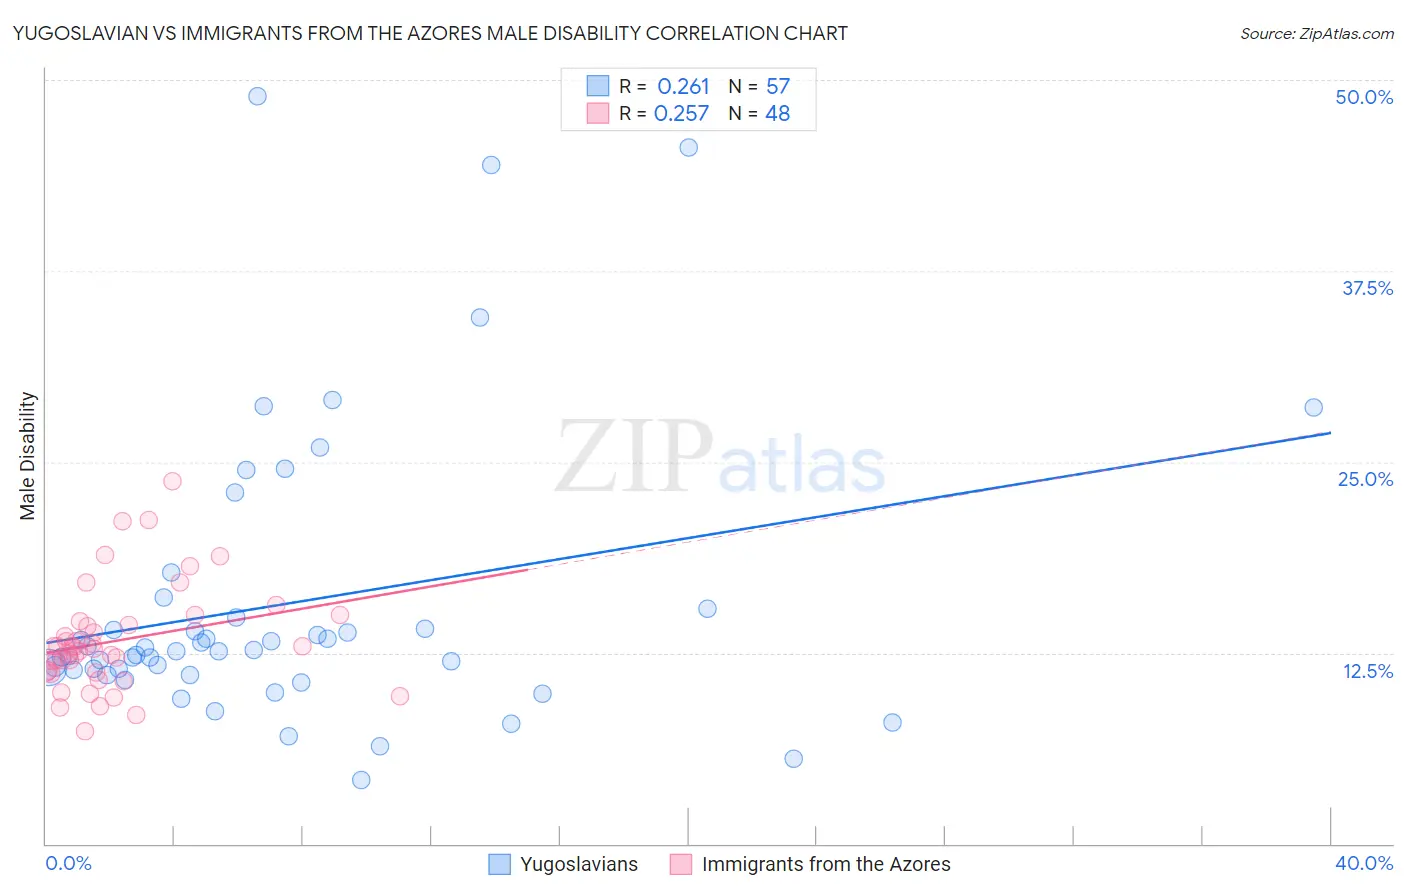
Yugoslavian vs Immigrants from the Azores Male Disability Correlation Chart
The statistical analysis conducted on geographies consisting of 285,684,891 people shows a weak positive correlation between the proportion of Yugoslavians and percentage of males with a disability in the United States with a correlation coefficient (R) of 0.261 and weighted average of 11.9%. Similarly, the statistical analysis conducted on geographies consisting of 46,257,178 people shows a weak positive correlation between the proportion of Immigrants from the Azores and percentage of males with a disability in the United States with a correlation coefficient (R) of 0.257 and weighted average of 13.4%, a difference of 12.9%.
Male Disability Correlation Summary
| Measurement | Yugoslavian | Immigrants from the Azores |
| Minimum | 4.2% | 7.4% |
| Maximum | 48.9% | 23.7% |
| Range | 44.8% | 16.3% |
| Mean | 15.7% | 13.3% |
| Median | 12.6% | 12.8% |
| Interquartile 25% (IQ1) | 11.2% | 11.2% |
| Interquartile 75% (IQ3) | 15.1% | 14.4% |
| Interquartile Range (IQR) | 3.9% | 3.2% |
| Standard Deviation (Sample) | 9.5% | 3.4% |
| Standard Deviation (Population) | 9.4% | 3.4% |
Similar Demographics by Male Disability
Demographics Similar to Yugoslavians by Male Disability
In terms of male disability, the demographic groups most similar to Yugoslavians are Italian (11.9%, a difference of 0.050%), Carpatho Rusyn (11.9%, a difference of 0.10%), Czech (11.9%, a difference of 0.10%), U.S. Virgin Islander (11.9%, a difference of 0.11%), and Bahamian (11.9%, a difference of 0.14%).
| Demographics | Rating | Rank | Male Disability |
| Dominicans | 1.8 /100 | #231 | Tragic 11.8% |
| Malaysians | 1.8 /100 | #232 | Tragic 11.8% |
| Mexicans | 1.7 /100 | #233 | Tragic 11.8% |
| Immigrants | Canada | 1.6 /100 | #234 | Tragic 11.9% |
| Immigrants | North America | 1.5 /100 | #235 | Tragic 11.9% |
| U.S. Virgin Islanders | 1.3 /100 | #236 | Tragic 11.9% |
| Carpatho Rusyns | 1.3 /100 | #237 | Tragic 11.9% |
| Yugoslavians | 1.2 /100 | #238 | Tragic 11.9% |
| Italians | 1.2 /100 | #239 | Tragic 11.9% |
| Czechs | 1.1 /100 | #240 | Tragic 11.9% |
| Bahamians | 1.1 /100 | #241 | Tragic 11.9% |
| Northern Europeans | 1.1 /100 | #242 | Tragic 11.9% |
| Samoans | 1.1 /100 | #243 | Tragic 11.9% |
| Immigrants | Laos | 1.0 /100 | #244 | Tragic 11.9% |
| Immigrants | Liberia | 1.0 /100 | #245 | Tragic 11.9% |
Demographics Similar to Immigrants from the Azores by Male Disability
In terms of male disability, the demographic groups most similar to Immigrants from the Azores are Blackfeet (13.4%, a difference of 0.14%), Delaware (13.5%, a difference of 0.19%), French American Indian (13.4%, a difference of 0.56%), Arapaho (13.3%, a difference of 0.72%), and Yakama (13.5%, a difference of 0.74%).
| Demographics | Rating | Rank | Male Disability |
| Scotch-Irish | 0.0 /100 | #303 | Tragic 13.2% |
| Blacks/African Americans | 0.0 /100 | #304 | Tragic 13.2% |
| French Canadians | 0.0 /100 | #305 | Tragic 13.3% |
| Spanish Americans | 0.0 /100 | #306 | Tragic 13.3% |
| Arapaho | 0.0 /100 | #307 | Tragic 13.3% |
| French American Indians | 0.0 /100 | #308 | Tragic 13.4% |
| Blackfeet | 0.0 /100 | #309 | Tragic 13.4% |
| Immigrants | Azores | 0.0 /100 | #310 | Tragic 13.4% |
| Delaware | 0.0 /100 | #311 | Tragic 13.5% |
| Yakama | 0.0 /100 | #312 | Tragic 13.5% |
| Puget Sound Salish | 0.0 /100 | #313 | Tragic 13.5% |
| Aleuts | 0.0 /100 | #314 | Tragic 13.5% |
| Iroquois | 0.0 /100 | #315 | Tragic 13.6% |
| Alaska Natives | 0.0 /100 | #316 | Tragic 13.6% |
| Paiute | 0.0 /100 | #317 | Tragic 13.7% |