Yugoslavian vs Trinidadian and Tobagonian Single Father Households
COMPARE
Yugoslavian
Trinidadian and Tobagonian
Single Father Households
Single Father Households Comparison
Yugoslavians
Trinidadians and Tobagonians
2.3%
SINGLE FATHER HOUSEHOLDS
43.9/ 100
METRIC RATING
180th/ 347
METRIC RANK
2.2%
SINGLE FATHER HOUSEHOLDS
97.8/ 100
METRIC RATING
119th/ 347
METRIC RANK
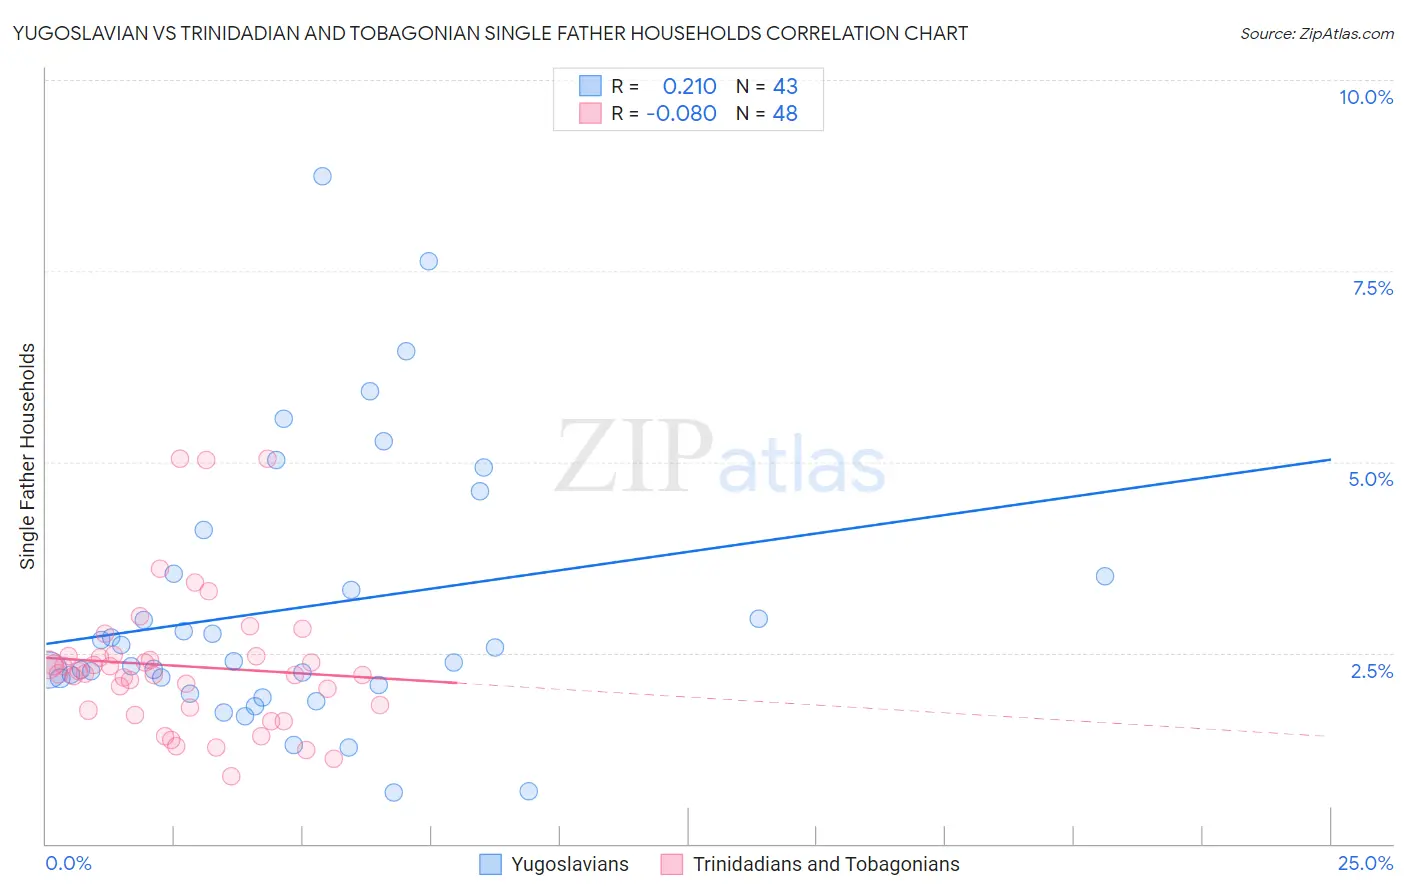
Yugoslavian vs Trinidadian and Tobagonian Single Father Households Correlation Chart
The statistical analysis conducted on geographies consisting of 284,087,326 people shows a weak positive correlation between the proportion of Yugoslavians and percentage of single father households in the United States with a correlation coefficient (R) of 0.210 and weighted average of 2.3%. Similarly, the statistical analysis conducted on geographies consisting of 218,763,381 people shows a slight negative correlation between the proportion of Trinidadians and Tobagonians and percentage of single father households in the United States with a correlation coefficient (R) of -0.080 and weighted average of 2.2%, a difference of 8.0%.
Single Father Households Correlation Summary
| Measurement | Yugoslavian | Trinidadian and Tobagonian |
| Minimum | 0.67% | 0.89% |
| Maximum | 8.7% | 5.0% |
| Range | 8.1% | 4.2% |
| Mean | 3.1% | 2.3% |
| Median | 2.4% | 2.2% |
| Interquartile 25% (IQ1) | 2.1% | 1.8% |
| Interquartile 75% (IQ3) | 3.5% | 2.5% |
| Interquartile Range (IQR) | 1.5% | 0.69% |
| Standard Deviation (Sample) | 1.8% | 0.92% |
| Standard Deviation (Population) | 1.7% | 0.91% |
Similar Demographics by Single Father Households
Demographics Similar to Yugoslavians by Single Father Households
In terms of single father households, the demographic groups most similar to Yugoslavians are Welsh (2.3%, a difference of 0.010%), Costa Rican (2.3%, a difference of 0.020%), Jamaican (2.3%, a difference of 0.030%), Belgian (2.3%, a difference of 0.040%), and Immigrants from Panama (2.4%, a difference of 0.15%).
| Demographics | Rating | Rank | Single Father Households |
| Celtics | 55.4 /100 | #173 | Average 2.3% |
| Afghans | 50.0 /100 | #174 | Average 2.3% |
| Immigrants | Jamaica | 49.1 /100 | #175 | Average 2.3% |
| Danes | 48.2 /100 | #176 | Average 2.3% |
| Colombians | 48.0 /100 | #177 | Average 2.3% |
| Costa Ricans | 44.1 /100 | #178 | Average 2.3% |
| Welsh | 44.0 /100 | #179 | Average 2.3% |
| Yugoslavians | 43.9 /100 | #180 | Average 2.3% |
| Jamaicans | 43.5 /100 | #181 | Average 2.3% |
| Belgians | 43.3 /100 | #182 | Average 2.3% |
| Immigrants | Panama | 41.8 /100 | #183 | Average 2.4% |
| Sri Lankans | 41.8 /100 | #184 | Average 2.4% |
| Nigerians | 41.0 /100 | #185 | Average 2.4% |
| Immigrants | Bosnia and Herzegovina | 40.4 /100 | #186 | Average 2.4% |
| Immigrants | Colombia | 34.0 /100 | #187 | Fair 2.4% |
Demographics Similar to Trinidadians and Tobagonians by Single Father Households
In terms of single father households, the demographic groups most similar to Trinidadians and Tobagonians are Australian (2.2%, a difference of 0.030%), Immigrants from Brazil (2.2%, a difference of 0.040%), Immigrants from Morocco (2.2%, a difference of 0.060%), Immigrants from Iraq (2.2%, a difference of 0.13%), and Hungarian (2.2%, a difference of 0.16%).
| Demographics | Rating | Rank | Single Father Households |
| Immigrants | Trinidad and Tobago | 98.2 /100 | #112 | Exceptional 2.2% |
| Iraqis | 98.2 /100 | #113 | Exceptional 2.2% |
| Immigrants | North America | 98.2 /100 | #114 | Exceptional 2.2% |
| Immigrants | Barbados | 98.2 /100 | #115 | Exceptional 2.2% |
| Immigrants | Argentina | 98.1 /100 | #116 | Exceptional 2.2% |
| Hungarians | 97.9 /100 | #117 | Exceptional 2.2% |
| Immigrants | Morocco | 97.8 /100 | #118 | Exceptional 2.2% |
| Trinidadians and Tobagonians | 97.8 /100 | #119 | Exceptional 2.2% |
| Australians | 97.7 /100 | #120 | Exceptional 2.2% |
| Immigrants | Brazil | 97.7 /100 | #121 | Exceptional 2.2% |
| Immigrants | Iraq | 97.6 /100 | #122 | Exceptional 2.2% |
| Immigrants | Yemen | 97.5 /100 | #123 | Exceptional 2.2% |
| British West Indians | 97.4 /100 | #124 | Exceptional 2.2% |
| Immigrants | Indonesia | 97.4 /100 | #125 | Exceptional 2.2% |
| Moroccans | 96.9 /100 | #126 | Exceptional 2.2% |