Yugoslavian vs Turkish Male Disability
COMPARE
Yugoslavian
Turkish
Male Disability
Male Disability Comparison
Yugoslavians
Turks
11.9%
MALE DISABILITY
1.2/ 100
METRIC RATING
238th/ 347
METRIC RANK
10.3%
MALE DISABILITY
99.7/ 100
METRIC RATING
45th/ 347
METRIC RANK
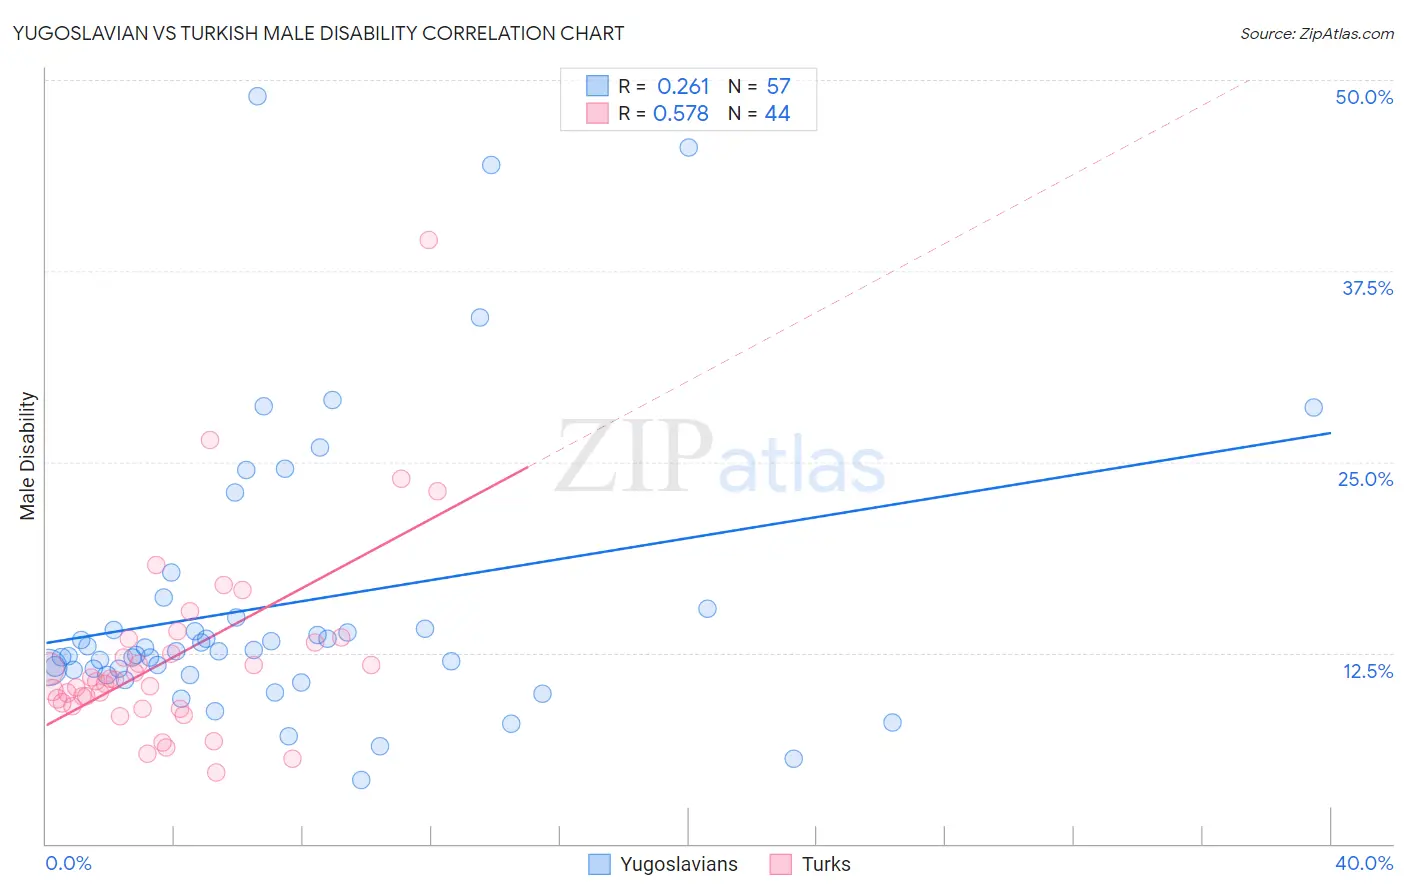
Yugoslavian vs Turkish Male Disability Correlation Chart
The statistical analysis conducted on geographies consisting of 285,684,891 people shows a weak positive correlation between the proportion of Yugoslavians and percentage of males with a disability in the United States with a correlation coefficient (R) of 0.261 and weighted average of 11.9%. Similarly, the statistical analysis conducted on geographies consisting of 271,851,914 people shows a substantial positive correlation between the proportion of Turks and percentage of males with a disability in the United States with a correlation coefficient (R) of 0.578 and weighted average of 10.3%, a difference of 15.5%.
Male Disability Correlation Summary
| Measurement | Yugoslavian | Turkish |
| Minimum | 4.2% | 4.6% |
| Maximum | 48.9% | 39.6% |
| Range | 44.8% | 34.9% |
| Mean | 15.7% | 12.2% |
| Median | 12.6% | 10.7% |
| Interquartile 25% (IQ1) | 11.2% | 9.1% |
| Interquartile 75% (IQ3) | 15.1% | 13.3% |
| Interquartile Range (IQR) | 3.9% | 4.2% |
| Standard Deviation (Sample) | 9.5% | 6.2% |
| Standard Deviation (Population) | 9.4% | 6.2% |
Similar Demographics by Male Disability
Demographics Similar to Yugoslavians by Male Disability
In terms of male disability, the demographic groups most similar to Yugoslavians are Italian (11.9%, a difference of 0.050%), Carpatho Rusyn (11.9%, a difference of 0.10%), Czech (11.9%, a difference of 0.10%), U.S. Virgin Islander (11.9%, a difference of 0.11%), and Bahamian (11.9%, a difference of 0.14%).
| Demographics | Rating | Rank | Male Disability |
| Dominicans | 1.8 /100 | #231 | Tragic 11.8% |
| Malaysians | 1.8 /100 | #232 | Tragic 11.8% |
| Mexicans | 1.7 /100 | #233 | Tragic 11.8% |
| Immigrants | Canada | 1.6 /100 | #234 | Tragic 11.9% |
| Immigrants | North America | 1.5 /100 | #235 | Tragic 11.9% |
| U.S. Virgin Islanders | 1.3 /100 | #236 | Tragic 11.9% |
| Carpatho Rusyns | 1.3 /100 | #237 | Tragic 11.9% |
| Yugoslavians | 1.2 /100 | #238 | Tragic 11.9% |
| Italians | 1.2 /100 | #239 | Tragic 11.9% |
| Czechs | 1.1 /100 | #240 | Tragic 11.9% |
| Bahamians | 1.1 /100 | #241 | Tragic 11.9% |
| Northern Europeans | 1.1 /100 | #242 | Tragic 11.9% |
| Samoans | 1.1 /100 | #243 | Tragic 11.9% |
| Immigrants | Laos | 1.0 /100 | #244 | Tragic 11.9% |
| Immigrants | Liberia | 1.0 /100 | #245 | Tragic 11.9% |
Demographics Similar to Turks by Male Disability
In terms of male disability, the demographic groups most similar to Turks are Immigrants from El Salvador (10.3%, a difference of 0.0%), Immigrants from Bangladesh (10.3%, a difference of 0.080%), Cambodian (10.3%, a difference of 0.080%), Mongolian (10.3%, a difference of 0.10%), and Immigrants from Peru (10.3%, a difference of 0.12%).
| Demographics | Rating | Rank | Male Disability |
| Immigrants | Kuwait | 99.8 /100 | #38 | Exceptional 10.2% |
| Afghans | 99.8 /100 | #39 | Exceptional 10.2% |
| Immigrants | Nepal | 99.8 /100 | #40 | Exceptional 10.3% |
| Taiwanese | 99.8 /100 | #41 | Exceptional 10.3% |
| Mongolians | 99.7 /100 | #42 | Exceptional 10.3% |
| Immigrants | Bangladesh | 99.7 /100 | #43 | Exceptional 10.3% |
| Immigrants | El Salvador | 99.7 /100 | #44 | Exceptional 10.3% |
| Turks | 99.7 /100 | #45 | Exceptional 10.3% |
| Cambodians | 99.7 /100 | #46 | Exceptional 10.3% |
| Immigrants | Peru | 99.7 /100 | #47 | Exceptional 10.3% |
| Israelis | 99.7 /100 | #48 | Exceptional 10.3% |
| Immigrants | Spain | 99.7 /100 | #49 | Exceptional 10.3% |
| South Americans | 99.6 /100 | #50 | Exceptional 10.3% |
| Salvadorans | 99.6 /100 | #51 | Exceptional 10.4% |
| Immigrants | Saudi Arabia | 99.6 /100 | #52 | Exceptional 10.4% |