White/Caucasian vs Inupiat Disability Age Over 75
COMPARE
White/Caucasian
Inupiat
Disability Age Over 75
Disability Age Over 75 Comparison
Whites/Caucasians
Inupiat
47.3%
DISABILITY AGE OVER 75
50.0/ 100
METRIC RATING
174th/ 347
METRIC RANK
58.4%
DISABILITY AGE OVER 75
0.0/ 100
METRIC RATING
345th/ 347
METRIC RANK
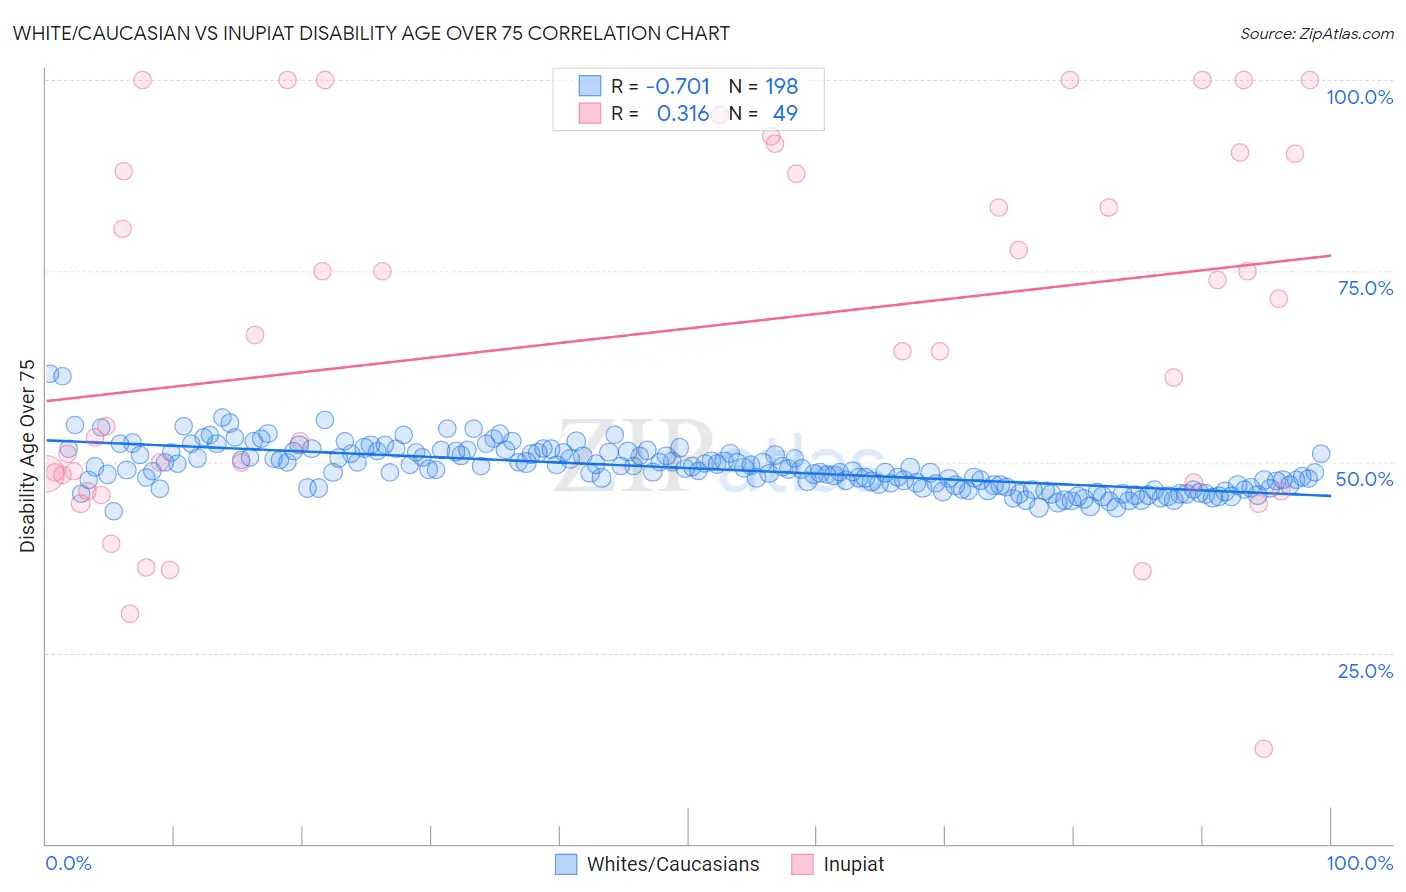
White/Caucasian vs Inupiat Disability Age Over 75 Correlation Chart
The statistical analysis conducted on geographies consisting of 580,540,031 people shows a strong negative correlation between the proportion of Whites/Caucasians and percentage of population with a disability over the age of 75 in the United States with a correlation coefficient (R) of -0.701 and weighted average of 47.3%. Similarly, the statistical analysis conducted on geographies consisting of 96,244,467 people shows a mild positive correlation between the proportion of Inupiat and percentage of population with a disability over the age of 75 in the United States with a correlation coefficient (R) of 0.316 and weighted average of 58.4%, a difference of 23.4%.
Disability Age Over 75 Correlation Summary
| Measurement | White/Caucasian | Inupiat |
| Minimum | 43.5% | 12.5% |
| Maximum | 61.5% | 100.0% |
| Range | 18.0% | 87.5% |
| Mean | 49.2% | 66.5% |
| Median | 49.0% | 64.5% |
| Interquartile 25% (IQ1) | 46.7% | 47.8% |
| Interquartile 75% (IQ3) | 51.2% | 89.2% |
| Interquartile Range (IQR) | 4.5% | 41.4% |
| Standard Deviation (Sample) | 3.0% | 23.4% |
| Standard Deviation (Population) | 3.0% | 23.2% |
Similar Demographics by Disability Age Over 75
Demographics Similar to Whites/Caucasians by Disability Age Over 75
In terms of disability age over 75, the demographic groups most similar to Whites/Caucasians are Immigrants from Haiti (47.3%, a difference of 0.010%), Alsatian (47.3%, a difference of 0.040%), Scotch-Irish (47.3%, a difference of 0.060%), Ecuadorian (47.4%, a difference of 0.070%), and Immigrants from Africa (47.3%, a difference of 0.080%).
| Demographics | Rating | Rank | Disability Age Over 75 |
| Moroccans | 62.9 /100 | #167 | Good 47.2% |
| Kenyans | 58.8 /100 | #168 | Average 47.2% |
| Celtics | 58.7 /100 | #169 | Average 47.2% |
| German Russians | 56.2 /100 | #170 | Average 47.3% |
| Immigrants | Africa | 53.6 /100 | #171 | Average 47.3% |
| Scotch-Irish | 52.5 /100 | #172 | Average 47.3% |
| Alsatians | 51.9 /100 | #173 | Average 47.3% |
| Whites/Caucasians | 50.0 /100 | #174 | Average 47.3% |
| Immigrants | Haiti | 49.7 /100 | #175 | Average 47.3% |
| Ecuadorians | 46.7 /100 | #176 | Average 47.4% |
| Haitians | 44.6 /100 | #177 | Average 47.4% |
| Cubans | 42.1 /100 | #178 | Average 47.4% |
| Sierra Leoneans | 41.7 /100 | #179 | Average 47.4% |
| Immigrants | Ecuador | 41.7 /100 | #180 | Average 47.4% |
| Immigrants | Kazakhstan | 40.4 /100 | #181 | Average 47.4% |
Demographics Similar to Inupiat by Disability Age Over 75
In terms of disability age over 75, the demographic groups most similar to Inupiat are Navajo (58.3%, a difference of 0.20%), Tsimshian (59.2%, a difference of 1.4%), Tohono O'odham (56.7%, a difference of 3.0%), Lumbee (56.2%, a difference of 3.8%), and Houma (56.2%, a difference of 4.0%).
| Demographics | Rating | Rank | Disability Age Over 75 |
| Apache | 0.0 /100 | #333 | Tragic 53.6% |
| Alaskan Athabascans | 0.0 /100 | #334 | Tragic 54.0% |
| Kiowa | 0.0 /100 | #335 | Tragic 54.2% |
| Immigrants | Armenia | 0.0 /100 | #336 | Tragic 54.3% |
| Yuman | 0.0 /100 | #337 | Tragic 54.4% |
| Colville | 0.0 /100 | #338 | Tragic 55.4% |
| Pima | 0.0 /100 | #339 | Tragic 55.8% |
| Pueblo | 0.0 /100 | #340 | Tragic 55.9% |
| Houma | 0.0 /100 | #341 | Tragic 56.2% |
| Lumbee | 0.0 /100 | #342 | Tragic 56.2% |
| Tohono O'odham | 0.0 /100 | #343 | Tragic 56.7% |
| Navajo | 0.0 /100 | #344 | Tragic 58.3% |
| Inupiat | 0.0 /100 | #345 | Tragic 58.4% |
| Tsimshian | 0.0 /100 | #346 | Tragic 59.2% |
| Yup'ik | 0.0 /100 | #347 | Tragic 61.1% |