Mongolian vs Inupiat Disability Age Over 75
COMPARE
Mongolian
Inupiat
Disability Age Over 75
Disability Age Over 75 Comparison
Mongolians
Inupiat
46.3%
DISABILITY AGE OVER 75
97.7/ 100
METRIC RATING
101st/ 347
METRIC RANK
58.4%
DISABILITY AGE OVER 75
0.0/ 100
METRIC RATING
345th/ 347
METRIC RANK
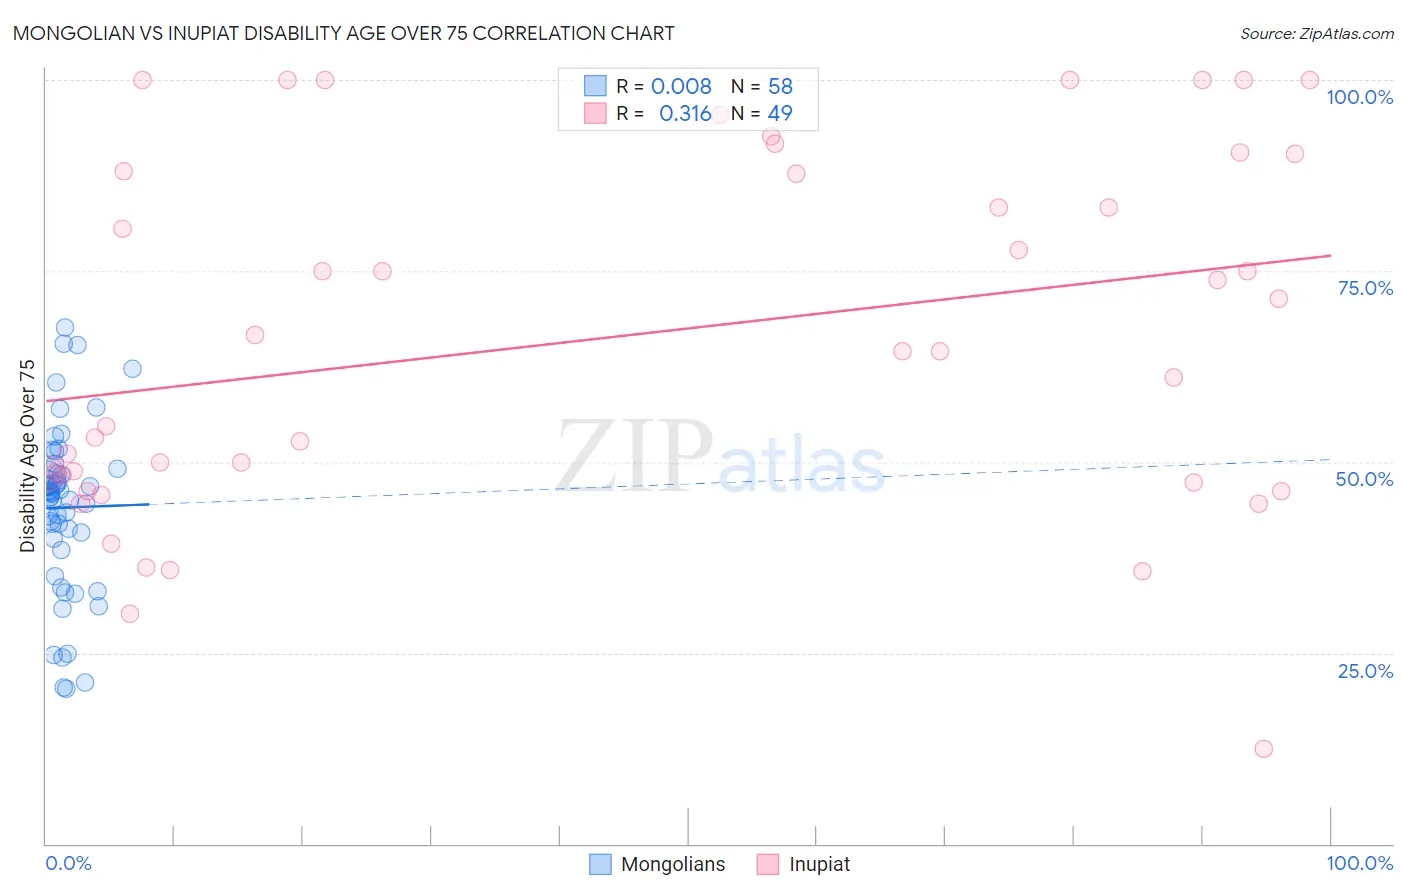
Mongolian vs Inupiat Disability Age Over 75 Correlation Chart
The statistical analysis conducted on geographies consisting of 140,199,354 people shows no correlation between the proportion of Mongolians and percentage of population with a disability over the age of 75 in the United States with a correlation coefficient (R) of 0.008 and weighted average of 46.3%. Similarly, the statistical analysis conducted on geographies consisting of 96,244,467 people shows a mild positive correlation between the proportion of Inupiat and percentage of population with a disability over the age of 75 in the United States with a correlation coefficient (R) of 0.316 and weighted average of 58.4%, a difference of 26.0%.
Disability Age Over 75 Correlation Summary
| Measurement | Mongolian | Inupiat |
| Minimum | 20.3% | 12.5% |
| Maximum | 67.6% | 100.0% |
| Range | 47.4% | 87.5% |
| Mean | 44.0% | 66.5% |
| Median | 45.9% | 64.5% |
| Interquartile 25% (IQ1) | 39.9% | 47.8% |
| Interquartile 75% (IQ3) | 48.5% | 89.2% |
| Interquartile Range (IQR) | 8.5% | 41.4% |
| Standard Deviation (Sample) | 10.9% | 23.4% |
| Standard Deviation (Population) | 10.8% | 23.2% |
Similar Demographics by Disability Age Over 75
Demographics Similar to Mongolians by Disability Age Over 75
In terms of disability age over 75, the demographic groups most similar to Mongolians are Palestinian (46.3%, a difference of 0.0%), Immigrants from Eastern Europe (46.3%, a difference of 0.0%), Immigrants from Japan (46.3%, a difference of 0.040%), Finnish (46.3%, a difference of 0.050%), and Immigrants from Brazil (46.3%, a difference of 0.080%).
| Demographics | Rating | Rank | Disability Age Over 75 |
| Albanians | 98.1 /100 | #94 | Exceptional 46.3% |
| Immigrants | Brazil | 98.0 /100 | #95 | Exceptional 46.3% |
| Immigrants | China | 98.0 /100 | #96 | Exceptional 46.3% |
| Finns | 97.9 /100 | #97 | Exceptional 46.3% |
| Immigrants | Japan | 97.8 /100 | #98 | Exceptional 46.3% |
| Palestinians | 97.7 /100 | #99 | Exceptional 46.3% |
| Immigrants | Eastern Europe | 97.7 /100 | #100 | Exceptional 46.3% |
| Mongolians | 97.7 /100 | #101 | Exceptional 46.3% |
| Immigrants | Malaysia | 97.1 /100 | #102 | Exceptional 46.4% |
| Ukrainians | 97.1 /100 | #103 | Exceptional 46.4% |
| Israelis | 97.0 /100 | #104 | Exceptional 46.4% |
| Immigrants | Cameroon | 96.9 /100 | #105 | Exceptional 46.4% |
| Immigrants | Kuwait | 96.8 /100 | #106 | Exceptional 46.4% |
| Immigrants | Uruguay | 96.7 /100 | #107 | Exceptional 46.4% |
| Brazilians | 96.6 /100 | #108 | Exceptional 46.5% |
Demographics Similar to Inupiat by Disability Age Over 75
In terms of disability age over 75, the demographic groups most similar to Inupiat are Navajo (58.3%, a difference of 0.20%), Tsimshian (59.2%, a difference of 1.4%), Tohono O'odham (56.7%, a difference of 3.0%), Lumbee (56.2%, a difference of 3.8%), and Houma (56.2%, a difference of 4.0%).
| Demographics | Rating | Rank | Disability Age Over 75 |
| Apache | 0.0 /100 | #333 | Tragic 53.6% |
| Alaskan Athabascans | 0.0 /100 | #334 | Tragic 54.0% |
| Kiowa | 0.0 /100 | #335 | Tragic 54.2% |
| Immigrants | Armenia | 0.0 /100 | #336 | Tragic 54.3% |
| Yuman | 0.0 /100 | #337 | Tragic 54.4% |
| Colville | 0.0 /100 | #338 | Tragic 55.4% |
| Pima | 0.0 /100 | #339 | Tragic 55.8% |
| Pueblo | 0.0 /100 | #340 | Tragic 55.9% |
| Houma | 0.0 /100 | #341 | Tragic 56.2% |
| Lumbee | 0.0 /100 | #342 | Tragic 56.2% |
| Tohono O'odham | 0.0 /100 | #343 | Tragic 56.7% |
| Navajo | 0.0 /100 | #344 | Tragic 58.3% |
| Inupiat | 0.0 /100 | #345 | Tragic 58.4% |
| Tsimshian | 0.0 /100 | #346 | Tragic 59.2% |
| Yup'ik | 0.0 /100 | #347 | Tragic 61.1% |