White/Caucasian vs Marshallese Disability Age Over 75
COMPARE
White/Caucasian
Marshallese
Disability Age Over 75
Disability Age Over 75 Comparison
Whites/Caucasians
Marshallese
47.3%
DISABILITY AGE OVER 75
50.0/ 100
METRIC RATING
174th/ 347
METRIC RANK
50.1%
DISABILITY AGE OVER 75
0.0/ 100
METRIC RATING
298th/ 347
METRIC RANK
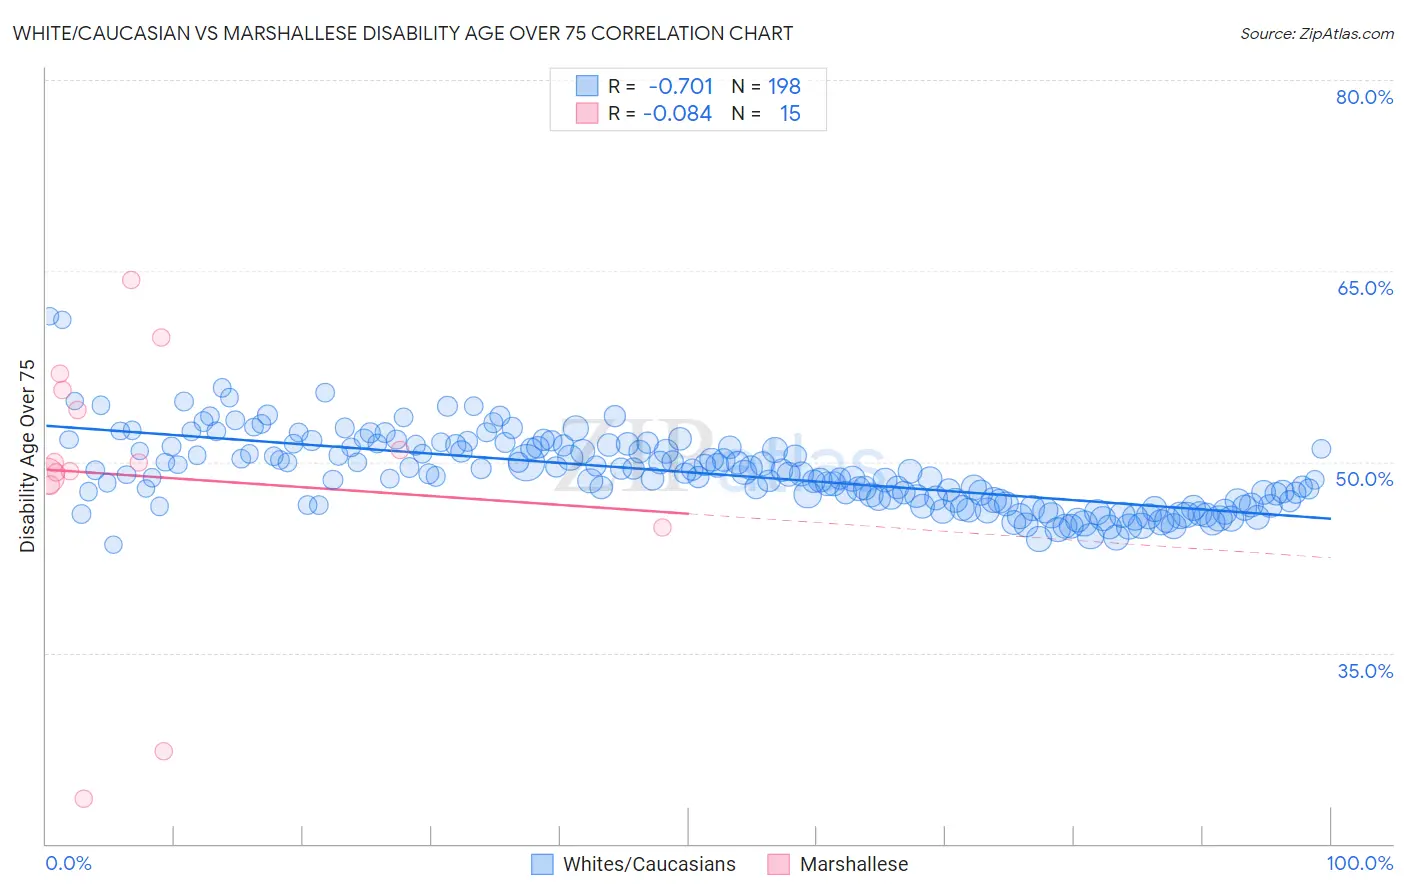
White/Caucasian vs Marshallese Disability Age Over 75 Correlation Chart
The statistical analysis conducted on geographies consisting of 580,540,031 people shows a strong negative correlation between the proportion of Whites/Caucasians and percentage of population with a disability over the age of 75 in the United States with a correlation coefficient (R) of -0.701 and weighted average of 47.3%. Similarly, the statistical analysis conducted on geographies consisting of 14,759,035 people shows a slight negative correlation between the proportion of Marshallese and percentage of population with a disability over the age of 75 in the United States with a correlation coefficient (R) of -0.084 and weighted average of 50.1%, a difference of 5.8%.
Disability Age Over 75 Correlation Summary
| Measurement | White/Caucasian | Marshallese |
| Minimum | 43.5% | 23.5% |
| Maximum | 61.5% | 64.3% |
| Range | 18.0% | 40.8% |
| Mean | 49.2% | 48.9% |
| Median | 49.0% | 49.9% |
| Interquartile 25% (IQ1) | 46.7% | 48.2% |
| Interquartile 75% (IQ3) | 51.2% | 55.7% |
| Interquartile Range (IQR) | 4.5% | 7.5% |
| Standard Deviation (Sample) | 3.0% | 10.8% |
| Standard Deviation (Population) | 3.0% | 10.4% |
Similar Demographics by Disability Age Over 75
Demographics Similar to Whites/Caucasians by Disability Age Over 75
In terms of disability age over 75, the demographic groups most similar to Whites/Caucasians are Immigrants from Haiti (47.3%, a difference of 0.010%), Alsatian (47.3%, a difference of 0.040%), Scotch-Irish (47.3%, a difference of 0.060%), Ecuadorian (47.4%, a difference of 0.070%), and Immigrants from Africa (47.3%, a difference of 0.080%).
| Demographics | Rating | Rank | Disability Age Over 75 |
| Moroccans | 62.9 /100 | #167 | Good 47.2% |
| Kenyans | 58.8 /100 | #168 | Average 47.2% |
| Celtics | 58.7 /100 | #169 | Average 47.2% |
| German Russians | 56.2 /100 | #170 | Average 47.3% |
| Immigrants | Africa | 53.6 /100 | #171 | Average 47.3% |
| Scotch-Irish | 52.5 /100 | #172 | Average 47.3% |
| Alsatians | 51.9 /100 | #173 | Average 47.3% |
| Whites/Caucasians | 50.0 /100 | #174 | Average 47.3% |
| Immigrants | Haiti | 49.7 /100 | #175 | Average 47.3% |
| Ecuadorians | 46.7 /100 | #176 | Average 47.4% |
| Haitians | 44.6 /100 | #177 | Average 47.4% |
| Cubans | 42.1 /100 | #178 | Average 47.4% |
| Sierra Leoneans | 41.7 /100 | #179 | Average 47.4% |
| Immigrants | Ecuador | 41.7 /100 | #180 | Average 47.4% |
| Immigrants | Kazakhstan | 40.4 /100 | #181 | Average 47.4% |
Demographics Similar to Marshallese by Disability Age Over 75
In terms of disability age over 75, the demographic groups most similar to Marshallese are Armenian (50.0%, a difference of 0.050%), Immigrants from Micronesia (50.1%, a difference of 0.070%), Mexican American Indian (50.0%, a difference of 0.080%), Cape Verdean (50.1%, a difference of 0.10%), and Spanish American (50.0%, a difference of 0.12%).
| Demographics | Rating | Rank | Disability Age Over 75 |
| Arapaho | 0.0 /100 | #291 | Tragic 49.8% |
| Shoshone | 0.0 /100 | #292 | Tragic 49.9% |
| Spanish American Indians | 0.0 /100 | #293 | Tragic 49.9% |
| Immigrants | Cambodia | 0.0 /100 | #294 | Tragic 50.0% |
| Spanish Americans | 0.0 /100 | #295 | Tragic 50.0% |
| Mexican American Indians | 0.0 /100 | #296 | Tragic 50.0% |
| Armenians | 0.0 /100 | #297 | Tragic 50.0% |
| Marshallese | 0.0 /100 | #298 | Tragic 50.1% |
| Immigrants | Micronesia | 0.0 /100 | #299 | Tragic 50.1% |
| Cape Verdeans | 0.0 /100 | #300 | Tragic 50.1% |
| Dominicans | 0.0 /100 | #301 | Tragic 50.2% |
| Cherokee | 0.0 /100 | #302 | Tragic 50.2% |
| Japanese | 0.0 /100 | #303 | Tragic 50.2% |
| Immigrants | Dominican Republic | 0.0 /100 | #304 | Tragic 50.3% |
| Central American Indians | 0.0 /100 | #305 | Tragic 50.5% |