White/Caucasian vs Iranian Disability Age Over 75
COMPARE
White/Caucasian
Iranian
Disability Age Over 75
Disability Age Over 75 Comparison
Whites/Caucasians
Iranians
47.3%
DISABILITY AGE OVER 75
50.0/ 100
METRIC RATING
174th/ 347
METRIC RANK
45.9%
DISABILITY AGE OVER 75
99.6/ 100
METRIC RATING
59th/ 347
METRIC RANK
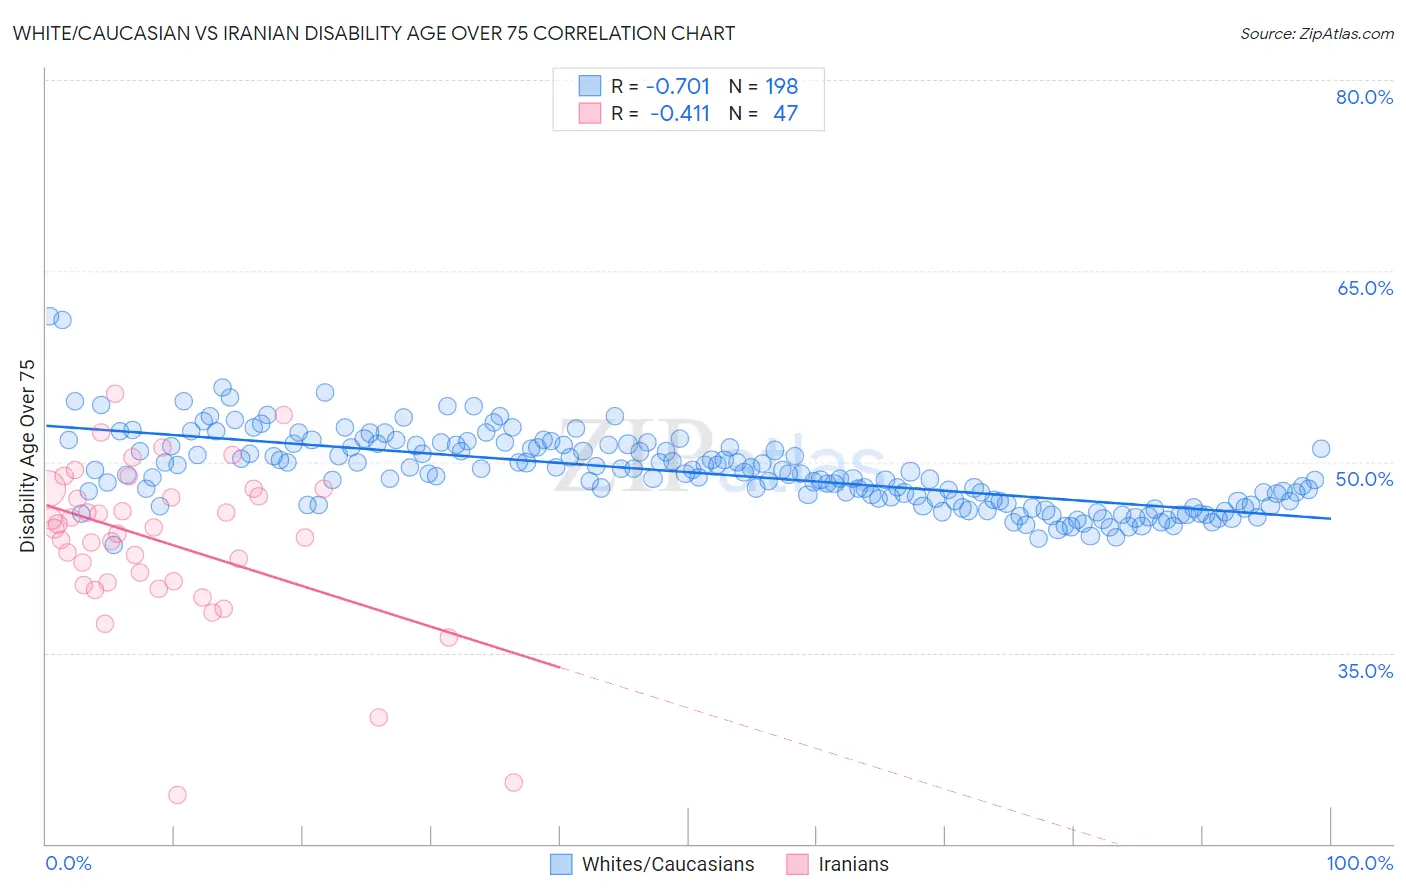
White/Caucasian vs Iranian Disability Age Over 75 Correlation Chart
The statistical analysis conducted on geographies consisting of 580,540,031 people shows a strong negative correlation between the proportion of Whites/Caucasians and percentage of population with a disability over the age of 75 in the United States with a correlation coefficient (R) of -0.701 and weighted average of 47.3%. Similarly, the statistical analysis conducted on geographies consisting of 316,376,826 people shows a moderate negative correlation between the proportion of Iranians and percentage of population with a disability over the age of 75 in the United States with a correlation coefficient (R) of -0.411 and weighted average of 45.9%, a difference of 3.2%.
Disability Age Over 75 Correlation Summary
| Measurement | White/Caucasian | Iranian |
| Minimum | 43.5% | 23.8% |
| Maximum | 61.5% | 55.3% |
| Range | 18.0% | 31.5% |
| Mean | 49.2% | 43.7% |
| Median | 49.0% | 44.7% |
| Interquartile 25% (IQ1) | 46.7% | 40.5% |
| Interquartile 75% (IQ3) | 51.2% | 47.9% |
| Interquartile Range (IQR) | 4.5% | 7.3% |
| Standard Deviation (Sample) | 3.0% | 6.4% |
| Standard Deviation (Population) | 3.0% | 6.3% |
Similar Demographics by Disability Age Over 75
Demographics Similar to Whites/Caucasians by Disability Age Over 75
In terms of disability age over 75, the demographic groups most similar to Whites/Caucasians are Immigrants from Haiti (47.3%, a difference of 0.010%), Alsatian (47.3%, a difference of 0.040%), Scotch-Irish (47.3%, a difference of 0.060%), Ecuadorian (47.4%, a difference of 0.070%), and Immigrants from Africa (47.3%, a difference of 0.080%).
| Demographics | Rating | Rank | Disability Age Over 75 |
| Moroccans | 62.9 /100 | #167 | Good 47.2% |
| Kenyans | 58.8 /100 | #168 | Average 47.2% |
| Celtics | 58.7 /100 | #169 | Average 47.2% |
| German Russians | 56.2 /100 | #170 | Average 47.3% |
| Immigrants | Africa | 53.6 /100 | #171 | Average 47.3% |
| Scotch-Irish | 52.5 /100 | #172 | Average 47.3% |
| Alsatians | 51.9 /100 | #173 | Average 47.3% |
| Whites/Caucasians | 50.0 /100 | #174 | Average 47.3% |
| Immigrants | Haiti | 49.7 /100 | #175 | Average 47.3% |
| Ecuadorians | 46.7 /100 | #176 | Average 47.4% |
| Haitians | 44.6 /100 | #177 | Average 47.4% |
| Cubans | 42.1 /100 | #178 | Average 47.4% |
| Sierra Leoneans | 41.7 /100 | #179 | Average 47.4% |
| Immigrants | Ecuador | 41.7 /100 | #180 | Average 47.4% |
| Immigrants | Kazakhstan | 40.4 /100 | #181 | Average 47.4% |
Demographics Similar to Iranians by Disability Age Over 75
In terms of disability age over 75, the demographic groups most similar to Iranians are Immigrants from Europe (45.9%, a difference of 0.0%), Immigrants from Turkey (45.9%, a difference of 0.010%), Immigrants from Israel (45.9%, a difference of 0.010%), Immigrants from Netherlands (45.9%, a difference of 0.020%), and Immigrants from Argentina (45.9%, a difference of 0.020%).
| Demographics | Rating | Rank | Disability Age Over 75 |
| Immigrants | France | 99.7 /100 | #52 | Exceptional 45.8% |
| Immigrants | Italy | 99.7 /100 | #53 | Exceptional 45.8% |
| Slovaks | 99.6 /100 | #54 | Exceptional 45.8% |
| Maltese | 99.6 /100 | #55 | Exceptional 45.8% |
| Immigrants | Netherlands | 99.6 /100 | #56 | Exceptional 45.9% |
| Immigrants | Turkey | 99.6 /100 | #57 | Exceptional 45.9% |
| Immigrants | Israel | 99.6 /100 | #58 | Exceptional 45.9% |
| Iranians | 99.6 /100 | #59 | Exceptional 45.9% |
| Immigrants | Europe | 99.6 /100 | #60 | Exceptional 45.9% |
| Immigrants | Argentina | 99.6 /100 | #61 | Exceptional 45.9% |
| Burmese | 99.5 /100 | #62 | Exceptional 45.9% |
| Immigrants | Norway | 99.5 /100 | #63 | Exceptional 45.9% |
| Immigrants | North Macedonia | 99.5 /100 | #64 | Exceptional 45.9% |
| Austrians | 99.5 /100 | #65 | Exceptional 46.0% |
| Immigrants | England | 99.5 /100 | #66 | Exceptional 46.0% |