White/Caucasian vs Immigrants from Sweden Disability Age Over 75
COMPARE
White/Caucasian
Immigrants from Sweden
Disability Age Over 75
Disability Age Over 75 Comparison
Whites/Caucasians
Immigrants from Sweden
47.3%
DISABILITY AGE OVER 75
50.0/ 100
METRIC RATING
174th/ 347
METRIC RANK
45.1%
DISABILITY AGE OVER 75
100.0/ 100
METRIC RATING
15th/ 347
METRIC RANK
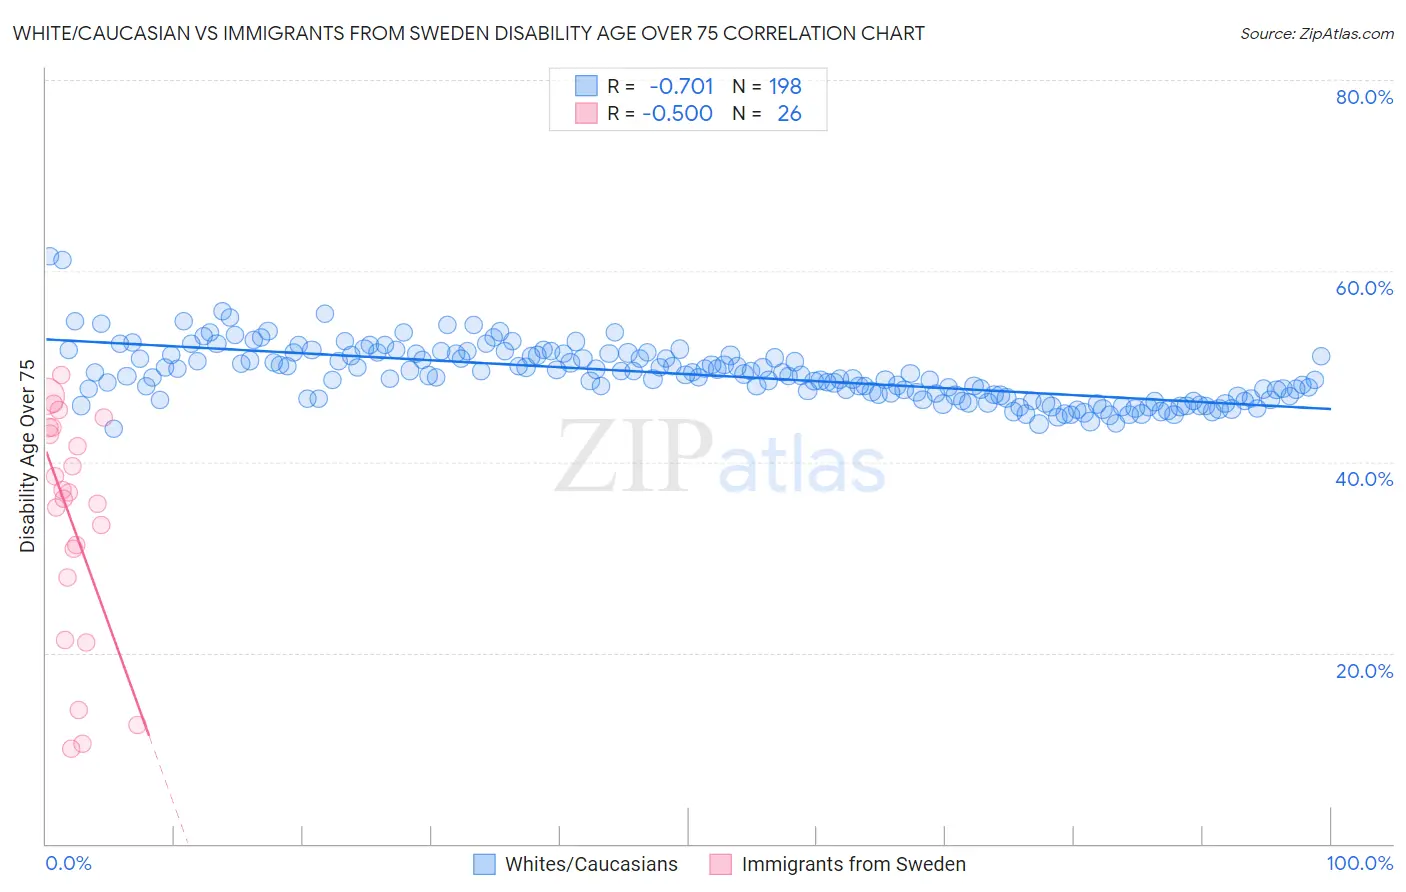
White/Caucasian vs Immigrants from Sweden Disability Age Over 75 Correlation Chart
The statistical analysis conducted on geographies consisting of 580,540,031 people shows a strong negative correlation between the proportion of Whites/Caucasians and percentage of population with a disability over the age of 75 in the United States with a correlation coefficient (R) of -0.701 and weighted average of 47.3%. Similarly, the statistical analysis conducted on geographies consisting of 164,657,038 people shows a moderate negative correlation between the proportion of Immigrants from Sweden and percentage of population with a disability over the age of 75 in the United States with a correlation coefficient (R) of -0.500 and weighted average of 45.1%, a difference of 4.9%.
Disability Age Over 75 Correlation Summary
| Measurement | White/Caucasian | Immigrants from Sweden |
| Minimum | 43.5% | 10.0% |
| Maximum | 61.5% | 49.2% |
| Range | 18.0% | 39.2% |
| Mean | 49.2% | 33.7% |
| Median | 49.0% | 36.5% |
| Interquartile 25% (IQ1) | 46.7% | 27.9% |
| Interquartile 75% (IQ3) | 51.2% | 43.5% |
| Interquartile Range (IQR) | 4.5% | 15.7% |
| Standard Deviation (Sample) | 3.0% | 11.9% |
| Standard Deviation (Population) | 3.0% | 11.7% |
Similar Demographics by Disability Age Over 75
Demographics Similar to Whites/Caucasians by Disability Age Over 75
In terms of disability age over 75, the demographic groups most similar to Whites/Caucasians are Immigrants from Haiti (47.3%, a difference of 0.010%), Alsatian (47.3%, a difference of 0.040%), Scotch-Irish (47.3%, a difference of 0.060%), Ecuadorian (47.4%, a difference of 0.070%), and Immigrants from Africa (47.3%, a difference of 0.080%).
| Demographics | Rating | Rank | Disability Age Over 75 |
| Moroccans | 62.9 /100 | #167 | Good 47.2% |
| Kenyans | 58.8 /100 | #168 | Average 47.2% |
| Celtics | 58.7 /100 | #169 | Average 47.2% |
| German Russians | 56.2 /100 | #170 | Average 47.3% |
| Immigrants | Africa | 53.6 /100 | #171 | Average 47.3% |
| Scotch-Irish | 52.5 /100 | #172 | Average 47.3% |
| Alsatians | 51.9 /100 | #173 | Average 47.3% |
| Whites/Caucasians | 50.0 /100 | #174 | Average 47.3% |
| Immigrants | Haiti | 49.7 /100 | #175 | Average 47.3% |
| Ecuadorians | 46.7 /100 | #176 | Average 47.4% |
| Haitians | 44.6 /100 | #177 | Average 47.4% |
| Cubans | 42.1 /100 | #178 | Average 47.4% |
| Sierra Leoneans | 41.7 /100 | #179 | Average 47.4% |
| Immigrants | Ecuador | 41.7 /100 | #180 | Average 47.4% |
| Immigrants | Kazakhstan | 40.4 /100 | #181 | Average 47.4% |
Demographics Similar to Immigrants from Sweden by Disability Age Over 75
In terms of disability age over 75, the demographic groups most similar to Immigrants from Sweden are Immigrants from Scotland (45.1%, a difference of 0.040%), Latvian (45.1%, a difference of 0.050%), Immigrants from Czechoslovakia (45.1%, a difference of 0.060%), Immigrants from Northern Europe (45.2%, a difference of 0.090%), and Immigrants from India (45.2%, a difference of 0.10%).
| Demographics | Rating | Rank | Disability Age Over 75 |
| Immigrants | Austria | 100.0 /100 | #8 | Exceptional 44.9% |
| Paraguayans | 100.0 /100 | #9 | Exceptional 45.0% |
| Bulgarians | 100.0 /100 | #10 | Exceptional 45.1% |
| Lithuanians | 100.0 /100 | #11 | Exceptional 45.1% |
| Immigrants | Czechoslovakia | 100.0 /100 | #12 | Exceptional 45.1% |
| Latvians | 100.0 /100 | #13 | Exceptional 45.1% |
| Immigrants | Scotland | 100.0 /100 | #14 | Exceptional 45.1% |
| Immigrants | Sweden | 100.0 /100 | #15 | Exceptional 45.1% |
| Immigrants | Northern Europe | 100.0 /100 | #16 | Exceptional 45.2% |
| Immigrants | India | 100.0 /100 | #17 | Exceptional 45.2% |
| Bolivians | 100.0 /100 | #18 | Exceptional 45.2% |
| Immigrants | Greece | 100.0 /100 | #19 | Exceptional 45.2% |
| Immigrants | Serbia | 100.0 /100 | #20 | Exceptional 45.3% |
| Immigrants | Belgium | 100.0 /100 | #21 | Exceptional 45.3% |
| Immigrants | South Africa | 100.0 /100 | #22 | Exceptional 45.3% |