White/Caucasian vs Immigrants from Portugal Disability Age Over 75
COMPARE
White/Caucasian
Immigrants from Portugal
Disability Age Over 75
Disability Age Over 75 Comparison
Whites/Caucasians
Immigrants from Portugal
47.3%
DISABILITY AGE OVER 75
50.0/ 100
METRIC RATING
174th/ 347
METRIC RANK
47.6%
DISABILITY AGE OVER 75
23.8/ 100
METRIC RATING
196th/ 347
METRIC RANK
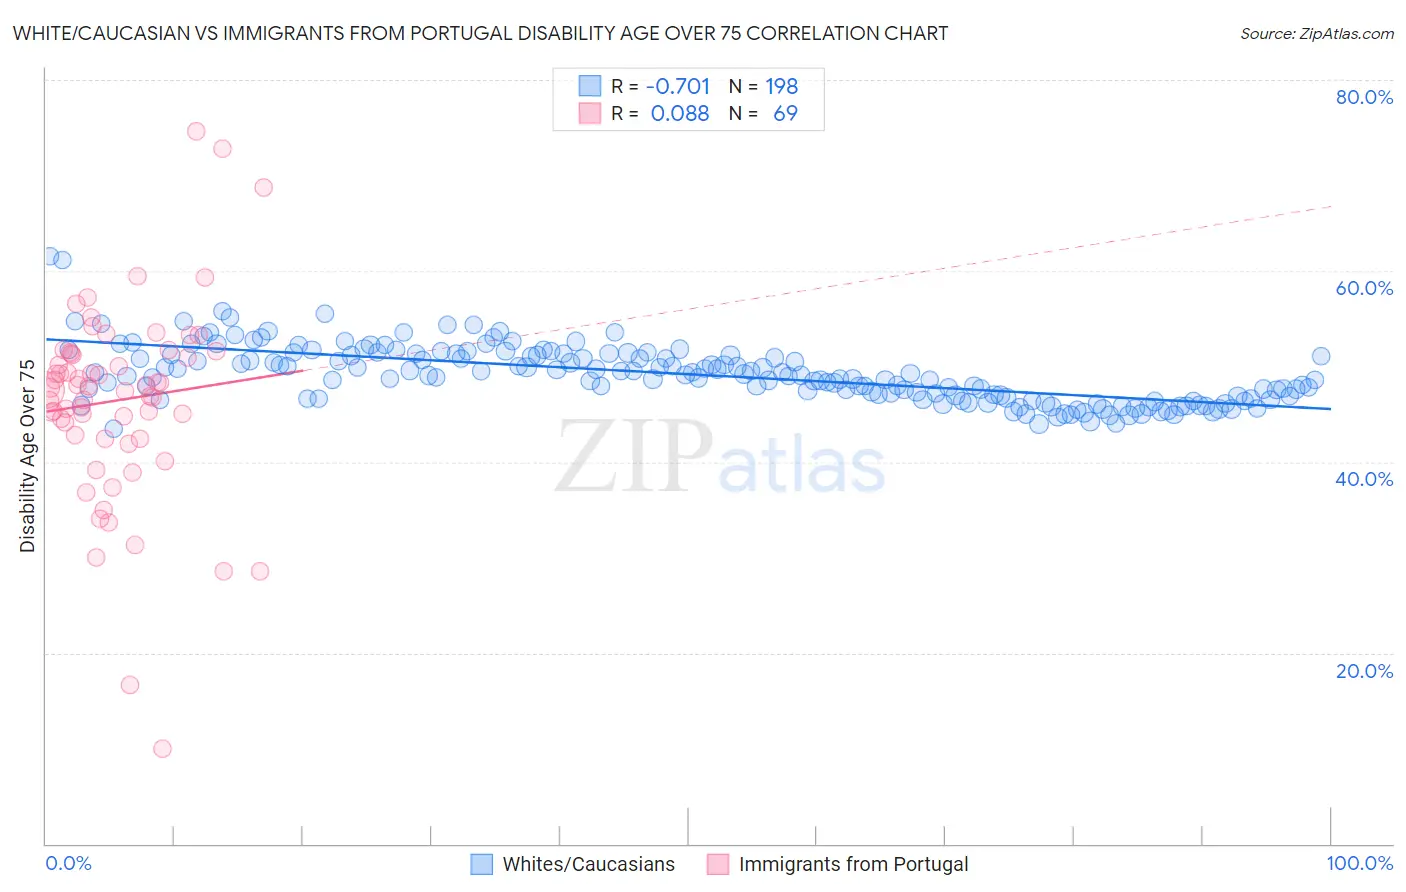
White/Caucasian vs Immigrants from Portugal Disability Age Over 75 Correlation Chart
The statistical analysis conducted on geographies consisting of 580,540,031 people shows a strong negative correlation between the proportion of Whites/Caucasians and percentage of population with a disability over the age of 75 in the United States with a correlation coefficient (R) of -0.701 and weighted average of 47.3%. Similarly, the statistical analysis conducted on geographies consisting of 174,707,158 people shows a slight positive correlation between the proportion of Immigrants from Portugal and percentage of population with a disability over the age of 75 in the United States with a correlation coefficient (R) of 0.088 and weighted average of 47.6%, a difference of 0.65%.
Disability Age Over 75 Correlation Summary
| Measurement | White/Caucasian | Immigrants from Portugal |
| Minimum | 43.5% | 10.0% |
| Maximum | 61.5% | 74.7% |
| Range | 18.0% | 64.7% |
| Mean | 49.2% | 46.5% |
| Median | 49.0% | 47.7% |
| Interquartile 25% (IQ1) | 46.7% | 42.6% |
| Interquartile 75% (IQ3) | 51.2% | 51.4% |
| Interquartile Range (IQR) | 4.5% | 8.8% |
| Standard Deviation (Sample) | 3.0% | 10.4% |
| Standard Deviation (Population) | 3.0% | 10.3% |
Similar Demographics by Disability Age Over 75
Demographics Similar to Whites/Caucasians by Disability Age Over 75
In terms of disability age over 75, the demographic groups most similar to Whites/Caucasians are Immigrants from Haiti (47.3%, a difference of 0.010%), Alsatian (47.3%, a difference of 0.040%), Scotch-Irish (47.3%, a difference of 0.060%), Ecuadorian (47.4%, a difference of 0.070%), and Immigrants from Africa (47.3%, a difference of 0.080%).
| Demographics | Rating | Rank | Disability Age Over 75 |
| Moroccans | 62.9 /100 | #167 | Good 47.2% |
| Kenyans | 58.8 /100 | #168 | Average 47.2% |
| Celtics | 58.7 /100 | #169 | Average 47.2% |
| German Russians | 56.2 /100 | #170 | Average 47.3% |
| Immigrants | Africa | 53.6 /100 | #171 | Average 47.3% |
| Scotch-Irish | 52.5 /100 | #172 | Average 47.3% |
| Alsatians | 51.9 /100 | #173 | Average 47.3% |
| Whites/Caucasians | 50.0 /100 | #174 | Average 47.3% |
| Immigrants | Haiti | 49.7 /100 | #175 | Average 47.3% |
| Ecuadorians | 46.7 /100 | #176 | Average 47.4% |
| Haitians | 44.6 /100 | #177 | Average 47.4% |
| Cubans | 42.1 /100 | #178 | Average 47.4% |
| Sierra Leoneans | 41.7 /100 | #179 | Average 47.4% |
| Immigrants | Ecuador | 41.7 /100 | #180 | Average 47.4% |
| Immigrants | Kazakhstan | 40.4 /100 | #181 | Average 47.4% |
Demographics Similar to Immigrants from Portugal by Disability Age Over 75
In terms of disability age over 75, the demographic groups most similar to Immigrants from Portugal are Pakistani (47.7%, a difference of 0.010%), Immigrants from Ukraine (47.7%, a difference of 0.020%), Immigrants from Eritrea (47.7%, a difference of 0.040%), Immigrants from Trinidad and Tobago (47.6%, a difference of 0.050%), and Immigrants from Lebanon (47.6%, a difference of 0.080%).
| Demographics | Rating | Rank | Disability Age Over 75 |
| Immigrants | Kenya | 30.8 /100 | #189 | Fair 47.6% |
| Somalis | 29.5 /100 | #190 | Fair 47.6% |
| Portuguese | 29.3 /100 | #191 | Fair 47.6% |
| Immigrants | Jamaica | 28.3 /100 | #192 | Fair 47.6% |
| Ottawa | 28.1 /100 | #193 | Fair 47.6% |
| Immigrants | Lebanon | 26.5 /100 | #194 | Fair 47.6% |
| Immigrants | Trinidad and Tobago | 25.3 /100 | #195 | Fair 47.6% |
| Immigrants | Portugal | 23.8 /100 | #196 | Fair 47.6% |
| Pakistanis | 23.4 /100 | #197 | Fair 47.7% |
| Immigrants | Ukraine | 23.2 /100 | #198 | Fair 47.7% |
| Immigrants | Eritrea | 22.4 /100 | #199 | Fair 47.7% |
| Immigrants | Somalia | 21.4 /100 | #200 | Fair 47.7% |
| Immigrants | Cuba | 20.9 /100 | #201 | Fair 47.7% |
| Immigrants | Bahamas | 20.7 /100 | #202 | Fair 47.7% |
| Trinidadians and Tobagonians | 20.0 /100 | #203 | Fair 47.7% |