White/Caucasian vs Inupiat Family Households with Children
COMPARE
White/Caucasian
Inupiat
Family Households with Children
Family Households with Children Comparison
Whites/Caucasians
Inupiat
27.4%
FAMILY HOUSEHOLDS WITH CHILDREN
50.0/ 100
METRIC RATING
174th/ 347
METRIC RANK
32.8%
FAMILY HOUSEHOLDS WITH CHILDREN
100/ 100
METRIC RATING
2nd/ 347
METRIC RANK
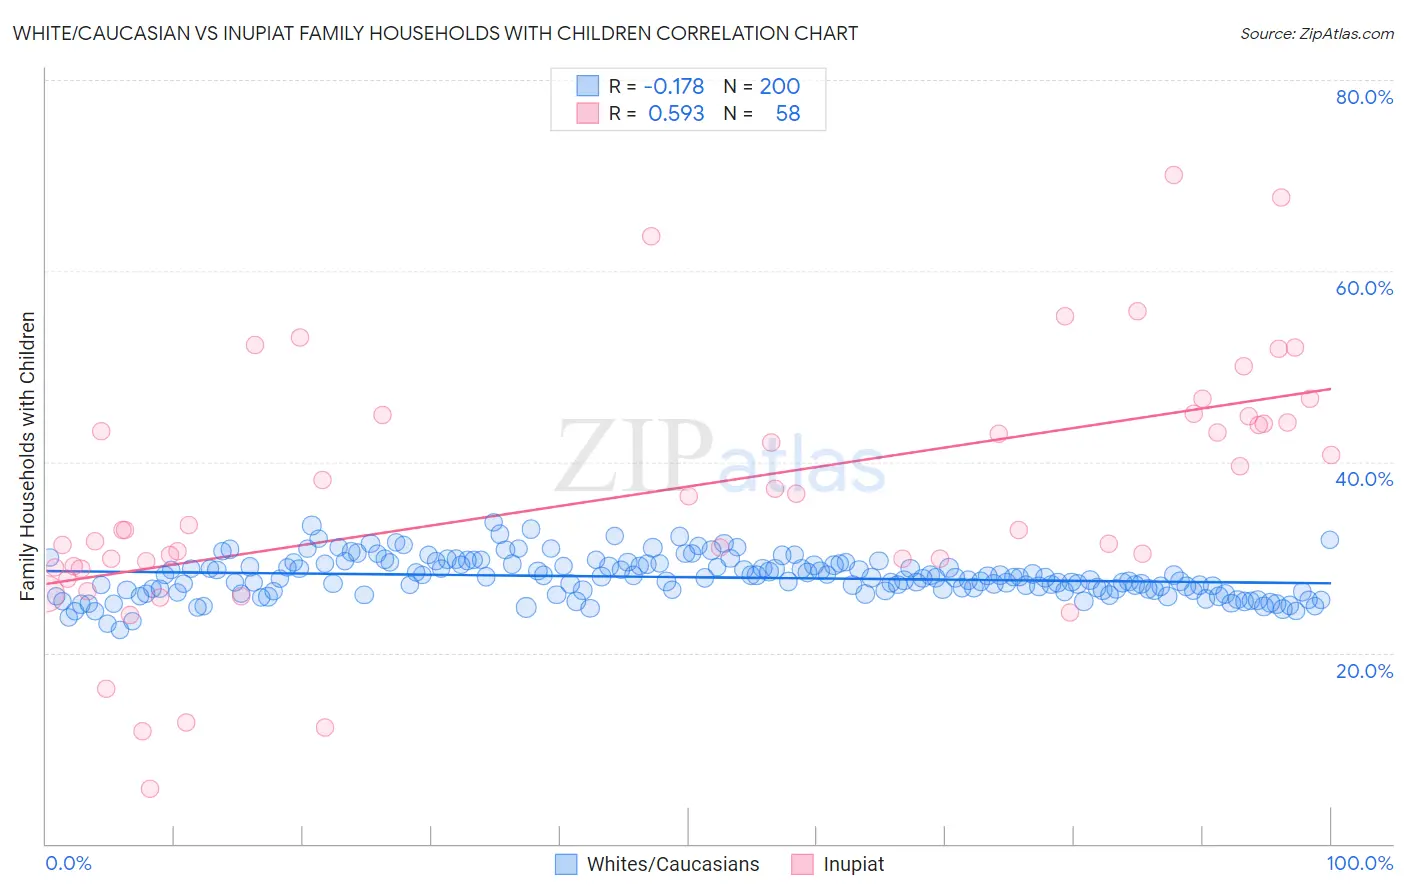
White/Caucasian vs Inupiat Family Households with Children Correlation Chart
The statistical analysis conducted on geographies consisting of 583,762,337 people shows a poor negative correlation between the proportion of Whites/Caucasians and percentage of family households with children in the United States with a correlation coefficient (R) of -0.178 and weighted average of 27.4%. Similarly, the statistical analysis conducted on geographies consisting of 96,318,609 people shows a substantial positive correlation between the proportion of Inupiat and percentage of family households with children in the United States with a correlation coefficient (R) of 0.593 and weighted average of 32.8%, a difference of 19.6%.
Family Households with Children Correlation Summary
| Measurement | White/Caucasian | Inupiat |
| Minimum | 22.4% | 5.8% |
| Maximum | 33.7% | 70.0% |
| Range | 11.3% | 64.2% |
| Mean | 27.9% | 36.6% |
| Median | 27.8% | 33.1% |
| Interquartile 25% (IQ1) | 26.5% | 29.1% |
| Interquartile 75% (IQ3) | 29.3% | 44.8% |
| Interquartile Range (IQR) | 2.8% | 15.7% |
| Standard Deviation (Sample) | 2.1% | 13.3% |
| Standard Deviation (Population) | 2.1% | 13.2% |
Similar Demographics by Family Households with Children
Demographics Similar to Whites/Caucasians by Family Households with Children
In terms of family households with children, the demographic groups most similar to Whites/Caucasians are British (27.4%, a difference of 0.0%), Immigrants from China (27.4%, a difference of 0.010%), Ugandan (27.4%, a difference of 0.020%), Spanish American (27.4%, a difference of 0.020%), and Immigrants from Argentina (27.5%, a difference of 0.050%).
| Demographics | Rating | Rank | Family Households with Children |
| Dominicans | 61.1 /100 | #167 | Good 27.5% |
| Immigrants | Kuwait | 60.9 /100 | #168 | Good 27.5% |
| Seminole | 56.9 /100 | #169 | Average 27.5% |
| Cherokee | 56.7 /100 | #170 | Average 27.5% |
| Blackfeet | 54.3 /100 | #171 | Average 27.5% |
| Israelis | 53.9 /100 | #172 | Average 27.5% |
| Immigrants | Argentina | 52.2 /100 | #173 | Average 27.5% |
| Whites/Caucasians | 50.0 /100 | #174 | Average 27.4% |
| British | 49.9 /100 | #175 | Average 27.4% |
| Immigrants | China | 49.6 /100 | #176 | Average 27.4% |
| Ugandans | 49.2 /100 | #177 | Average 27.4% |
| Spanish Americans | 48.9 /100 | #178 | Average 27.4% |
| Turks | 46.9 /100 | #179 | Average 27.4% |
| Immigrants | Turkey | 46.9 /100 | #180 | Average 27.4% |
| Aleuts | 46.7 /100 | #181 | Average 27.4% |
Demographics Similar to Inupiat by Family Households with Children
In terms of family households with children, the demographic groups most similar to Inupiat are Immigrants from Mexico (31.6%, a difference of 3.9%), Mexican (31.4%, a difference of 4.7%), Tongan (31.2%, a difference of 5.1%), Immigrants from India (31.0%, a difference of 5.8%), and Immigrants from Central America (31.0%, a difference of 6.1%).
| Demographics | Rating | Rank | Family Households with Children |
| Yup'ik | 100 /100 | #1 | Exceptional 37.0% |
| Inupiat | 100 /100 | #2 | Exceptional 32.8% |
| Immigrants | Mexico | 100.0 /100 | #3 | Exceptional 31.6% |
| Mexicans | 100.0 /100 | #4 | Exceptional 31.4% |
| Tongans | 100.0 /100 | #5 | Exceptional 31.2% |
| Immigrants | India | 100.0 /100 | #6 | Exceptional 31.0% |
| Immigrants | Central America | 100.0 /100 | #7 | Exceptional 31.0% |
| Yakama | 100.0 /100 | #8 | Exceptional 30.8% |
| Thais | 100.0 /100 | #9 | Exceptional 30.6% |
| Immigrants | Fiji | 100.0 /100 | #10 | Exceptional 30.5% |
| Nepalese | 100.0 /100 | #11 | Exceptional 30.5% |
| Immigrants | Pakistan | 100.0 /100 | #12 | Exceptional 30.2% |
| Afghans | 100.0 /100 | #13 | Exceptional 30.2% |
| Bangladeshis | 100.0 /100 | #14 | Exceptional 30.1% |
| Immigrants | South Central Asia | 100.0 /100 | #15 | Exceptional 30.0% |