White/Caucasian vs Apache Disability Age Over 75
COMPARE
White/Caucasian
Apache
Disability Age Over 75
Disability Age Over 75 Comparison
Whites/Caucasians
Apache
47.3%
DISABILITY AGE OVER 75
50.0/ 100
METRIC RATING
174th/ 347
METRIC RANK
53.6%
DISABILITY AGE OVER 75
0.0/ 100
METRIC RATING
333rd/ 347
METRIC RANK
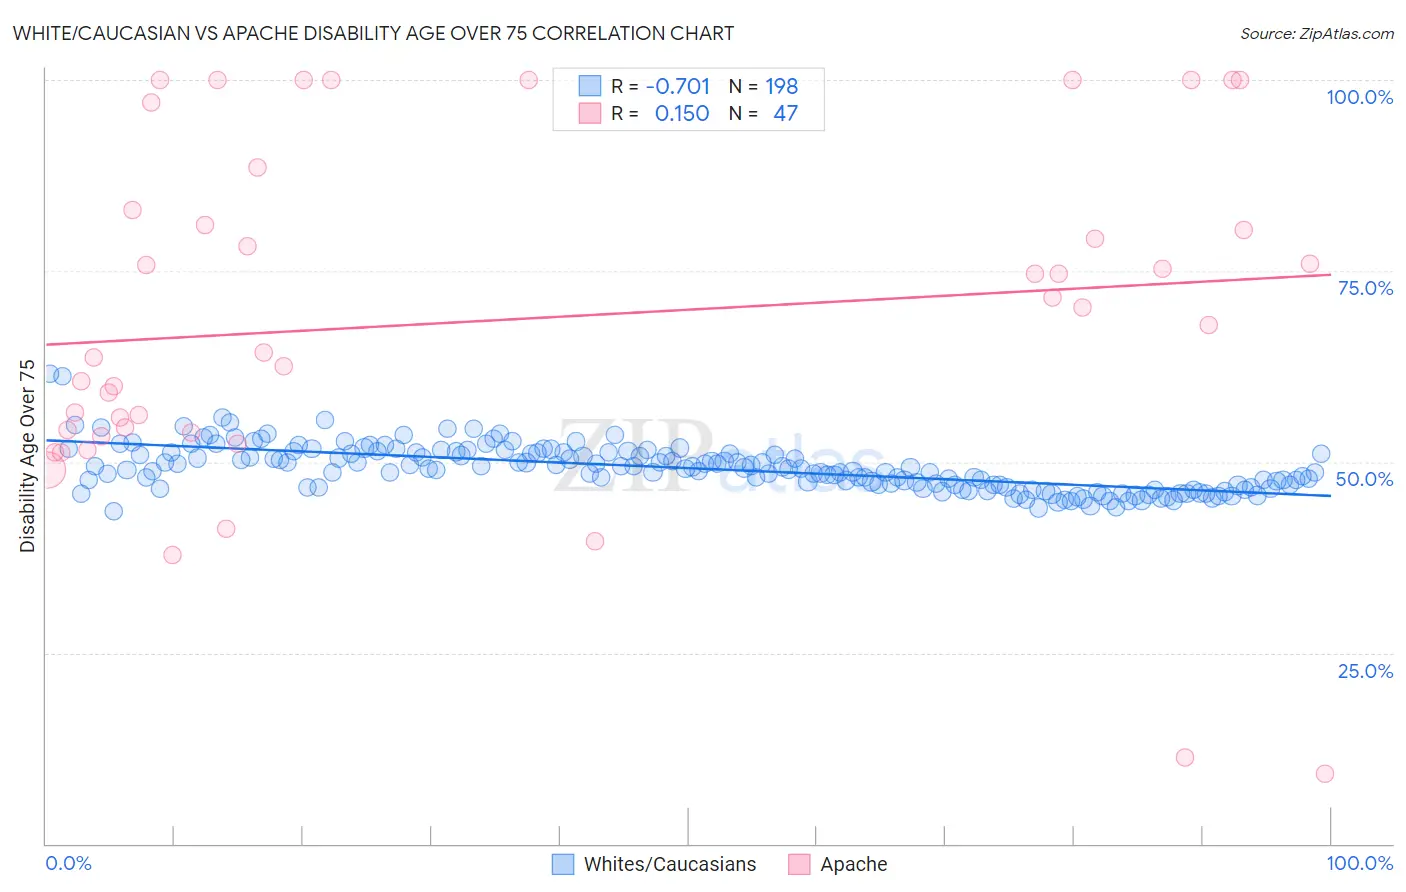
White/Caucasian vs Apache Disability Age Over 75 Correlation Chart
The statistical analysis conducted on geographies consisting of 580,540,031 people shows a strong negative correlation between the proportion of Whites/Caucasians and percentage of population with a disability over the age of 75 in the United States with a correlation coefficient (R) of -0.701 and weighted average of 47.3%. Similarly, the statistical analysis conducted on geographies consisting of 230,788,811 people shows a poor positive correlation between the proportion of Apache and percentage of population with a disability over the age of 75 in the United States with a correlation coefficient (R) of 0.150 and weighted average of 53.6%, a difference of 13.2%.
Disability Age Over 75 Correlation Summary
| Measurement | White/Caucasian | Apache |
| Minimum | 43.5% | 9.1% |
| Maximum | 61.5% | 100.0% |
| Range | 18.0% | 90.9% |
| Mean | 49.2% | 68.6% |
| Median | 49.0% | 68.0% |
| Interquartile 25% (IQ1) | 46.7% | 53.8% |
| Interquartile 75% (IQ3) | 51.2% | 83.0% |
| Interquartile Range (IQR) | 4.5% | 29.2% |
| Standard Deviation (Sample) | 3.0% | 22.6% |
| Standard Deviation (Population) | 3.0% | 22.4% |
Similar Demographics by Disability Age Over 75
Demographics Similar to Whites/Caucasians by Disability Age Over 75
In terms of disability age over 75, the demographic groups most similar to Whites/Caucasians are Immigrants from Haiti (47.3%, a difference of 0.010%), Alsatian (47.3%, a difference of 0.040%), Scotch-Irish (47.3%, a difference of 0.060%), Ecuadorian (47.4%, a difference of 0.070%), and Immigrants from Africa (47.3%, a difference of 0.080%).
| Demographics | Rating | Rank | Disability Age Over 75 |
| Moroccans | 62.9 /100 | #167 | Good 47.2% |
| Kenyans | 58.8 /100 | #168 | Average 47.2% |
| Celtics | 58.7 /100 | #169 | Average 47.2% |
| German Russians | 56.2 /100 | #170 | Average 47.3% |
| Immigrants | Africa | 53.6 /100 | #171 | Average 47.3% |
| Scotch-Irish | 52.5 /100 | #172 | Average 47.3% |
| Alsatians | 51.9 /100 | #173 | Average 47.3% |
| Whites/Caucasians | 50.0 /100 | #174 | Average 47.3% |
| Immigrants | Haiti | 49.7 /100 | #175 | Average 47.3% |
| Ecuadorians | 46.7 /100 | #176 | Average 47.4% |
| Haitians | 44.6 /100 | #177 | Average 47.4% |
| Cubans | 42.1 /100 | #178 | Average 47.4% |
| Sierra Leoneans | 41.7 /100 | #179 | Average 47.4% |
| Immigrants | Ecuador | 41.7 /100 | #180 | Average 47.4% |
| Immigrants | Kazakhstan | 40.4 /100 | #181 | Average 47.4% |
Demographics Similar to Apache by Disability Age Over 75
In terms of disability age over 75, the demographic groups most similar to Apache are Alaskan Athabascan (54.0%, a difference of 0.67%), Native/Alaskan (53.1%, a difference of 1.0%), Kiowa (54.2%, a difference of 1.2%), Hopi (52.9%, a difference of 1.3%), and Puerto Rican (52.9%, a difference of 1.3%).
| Demographics | Rating | Rank | Disability Age Over 75 |
| Ute | 0.0 /100 | #326 | Tragic 52.6% |
| Nepalese | 0.0 /100 | #327 | Tragic 52.6% |
| Choctaw | 0.0 /100 | #328 | Tragic 52.7% |
| Alaska Natives | 0.0 /100 | #329 | Tragic 52.8% |
| Puerto Ricans | 0.0 /100 | #330 | Tragic 52.9% |
| Hopi | 0.0 /100 | #331 | Tragic 52.9% |
| Natives/Alaskans | 0.0 /100 | #332 | Tragic 53.1% |
| Apache | 0.0 /100 | #333 | Tragic 53.6% |
| Alaskan Athabascans | 0.0 /100 | #334 | Tragic 54.0% |
| Kiowa | 0.0 /100 | #335 | Tragic 54.2% |
| Immigrants | Armenia | 0.0 /100 | #336 | Tragic 54.3% |
| Yuman | 0.0 /100 | #337 | Tragic 54.4% |
| Colville | 0.0 /100 | #338 | Tragic 55.4% |
| Pima | 0.0 /100 | #339 | Tragic 55.8% |
| Pueblo | 0.0 /100 | #340 | Tragic 55.9% |