White/Caucasian vs Chippewa Disability Age Over 75
COMPARE
White/Caucasian
Chippewa
Disability Age Over 75
Disability Age Over 75 Comparison
Whites/Caucasians
Chippewa
47.3%
DISABILITY AGE OVER 75
50.0/ 100
METRIC RATING
174th/ 347
METRIC RANK
48.4%
DISABILITY AGE OVER 75
1.6/ 100
METRIC RATING
246th/ 347
METRIC RANK
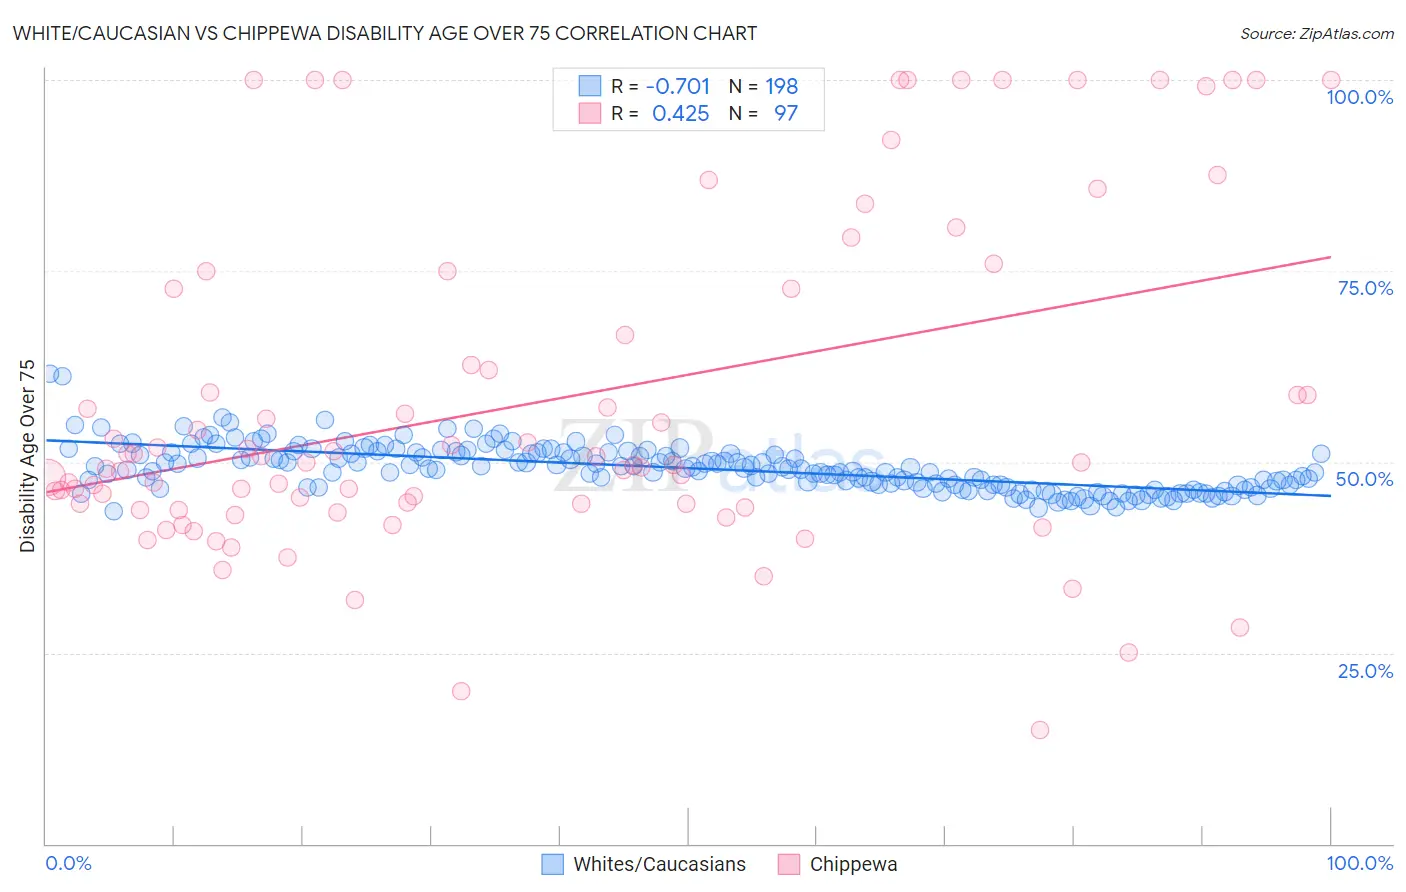
White/Caucasian vs Chippewa Disability Age Over 75 Correlation Chart
The statistical analysis conducted on geographies consisting of 580,540,031 people shows a strong negative correlation between the proportion of Whites/Caucasians and percentage of population with a disability over the age of 75 in the United States with a correlation coefficient (R) of -0.701 and weighted average of 47.3%. Similarly, the statistical analysis conducted on geographies consisting of 214,728,280 people shows a moderate positive correlation between the proportion of Chippewa and percentage of population with a disability over the age of 75 in the United States with a correlation coefficient (R) of 0.425 and weighted average of 48.4%, a difference of 2.3%.
Disability Age Over 75 Correlation Summary
| Measurement | White/Caucasian | Chippewa |
| Minimum | 43.5% | 14.8% |
| Maximum | 61.5% | 100.0% |
| Range | 18.0% | 85.2% |
| Mean | 49.2% | 57.7% |
| Median | 49.0% | 50.0% |
| Interquartile 25% (IQ1) | 46.7% | 44.2% |
| Interquartile 75% (IQ3) | 51.2% | 72.7% |
| Interquartile Range (IQR) | 4.5% | 28.5% |
| Standard Deviation (Sample) | 3.0% | 21.7% |
| Standard Deviation (Population) | 3.0% | 21.6% |
Similar Demographics by Disability Age Over 75
Demographics Similar to Whites/Caucasians by Disability Age Over 75
In terms of disability age over 75, the demographic groups most similar to Whites/Caucasians are Immigrants from Haiti (47.3%, a difference of 0.010%), Alsatian (47.3%, a difference of 0.040%), Scotch-Irish (47.3%, a difference of 0.060%), Ecuadorian (47.4%, a difference of 0.070%), and Immigrants from Africa (47.3%, a difference of 0.080%).
| Demographics | Rating | Rank | Disability Age Over 75 |
| Moroccans | 62.9 /100 | #167 | Good 47.2% |
| Kenyans | 58.8 /100 | #168 | Average 47.2% |
| Celtics | 58.7 /100 | #169 | Average 47.2% |
| German Russians | 56.2 /100 | #170 | Average 47.3% |
| Immigrants | Africa | 53.6 /100 | #171 | Average 47.3% |
| Scotch-Irish | 52.5 /100 | #172 | Average 47.3% |
| Alsatians | 51.9 /100 | #173 | Average 47.3% |
| Whites/Caucasians | 50.0 /100 | #174 | Average 47.3% |
| Immigrants | Haiti | 49.7 /100 | #175 | Average 47.3% |
| Ecuadorians | 46.7 /100 | #176 | Average 47.4% |
| Haitians | 44.6 /100 | #177 | Average 47.4% |
| Cubans | 42.1 /100 | #178 | Average 47.4% |
| Sierra Leoneans | 41.7 /100 | #179 | Average 47.4% |
| Immigrants | Ecuador | 41.7 /100 | #180 | Average 47.4% |
| Immigrants | Kazakhstan | 40.4 /100 | #181 | Average 47.4% |
Demographics Similar to Chippewa by Disability Age Over 75
In terms of disability age over 75, the demographic groups most similar to Chippewa are Iroquois (48.4%, a difference of 0.020%), American (48.4%, a difference of 0.030%), Afghan (48.4%, a difference of 0.060%), Sri Lankan (48.5%, a difference of 0.080%), and Immigrants from Caribbean (48.4%, a difference of 0.14%).
| Demographics | Rating | Rank | Disability Age Over 75 |
| Immigrants | Thailand | 2.8 /100 | #239 | Tragic 48.3% |
| Tongans | 2.3 /100 | #240 | Tragic 48.3% |
| Native Hawaiians | 2.2 /100 | #241 | Tragic 48.3% |
| French American Indians | 2.2 /100 | #242 | Tragic 48.3% |
| Immigrants | Caribbean | 2.1 /100 | #243 | Tragic 48.4% |
| Afghans | 1.8 /100 | #244 | Tragic 48.4% |
| Americans | 1.7 /100 | #245 | Tragic 48.4% |
| Chippewa | 1.6 /100 | #246 | Tragic 48.4% |
| Iroquois | 1.6 /100 | #247 | Tragic 48.4% |
| Sri Lankans | 1.4 /100 | #248 | Tragic 48.5% |
| Iraqis | 1.0 /100 | #249 | Tragic 48.6% |
| West Indians | 0.8 /100 | #250 | Tragic 48.6% |
| Koreans | 0.8 /100 | #251 | Tragic 48.6% |
| Immigrants | South Eastern Asia | 0.7 /100 | #252 | Tragic 48.7% |
| British West Indians | 0.6 /100 | #253 | Tragic 48.7% |