Immigrants from Burma/Myanmar vs Inupiat Disability Age Over 75
COMPARE
Immigrants from Burma/Myanmar
Inupiat
Disability Age Over 75
Disability Age Over 75 Comparison
Immigrants from Burma/Myanmar
Inupiat
47.9%
DISABILITY AGE OVER 75
11.7/ 100
METRIC RATING
212th/ 347
METRIC RANK
58.4%
DISABILITY AGE OVER 75
0.0/ 100
METRIC RATING
345th/ 347
METRIC RANK
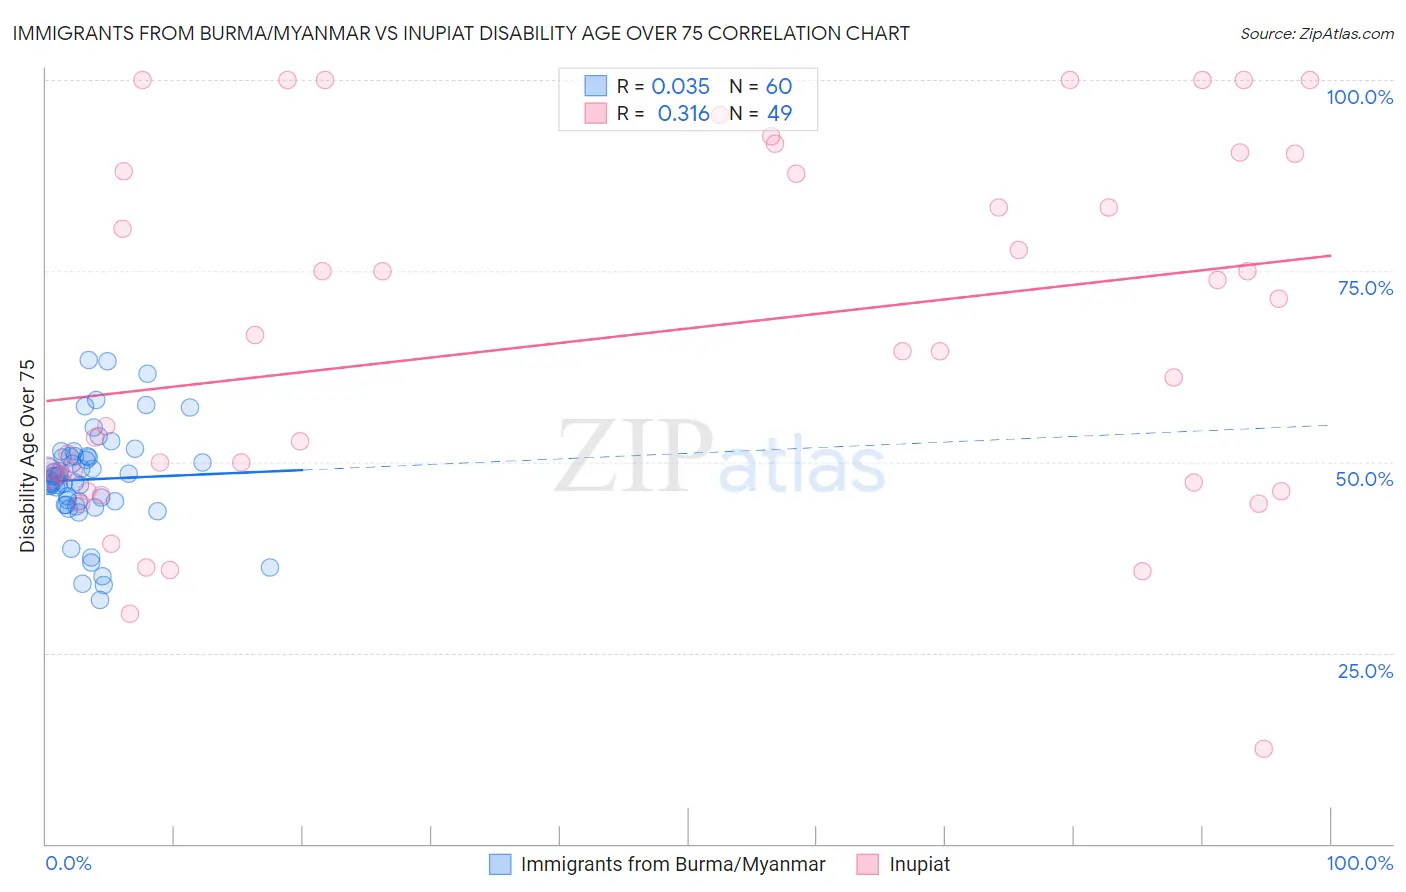
Immigrants from Burma/Myanmar vs Inupiat Disability Age Over 75 Correlation Chart
The statistical analysis conducted on geographies consisting of 172,144,400 people shows no correlation between the proportion of Immigrants from Burma/Myanmar and percentage of population with a disability over the age of 75 in the United States with a correlation coefficient (R) of 0.035 and weighted average of 47.9%. Similarly, the statistical analysis conducted on geographies consisting of 96,244,467 people shows a mild positive correlation between the proportion of Inupiat and percentage of population with a disability over the age of 75 in the United States with a correlation coefficient (R) of 0.316 and weighted average of 58.4%, a difference of 22.0%.
Disability Age Over 75 Correlation Summary
| Measurement | Immigrants from Burma/Myanmar | Inupiat |
| Minimum | 32.0% | 12.5% |
| Maximum | 63.4% | 100.0% |
| Range | 31.4% | 87.5% |
| Mean | 47.7% | 66.5% |
| Median | 48.1% | 64.5% |
| Interquartile 25% (IQ1) | 44.6% | 47.8% |
| Interquartile 75% (IQ3) | 50.7% | 89.2% |
| Interquartile Range (IQR) | 6.1% | 41.4% |
| Standard Deviation (Sample) | 6.7% | 23.4% |
| Standard Deviation (Population) | 6.6% | 23.2% |
Similar Demographics by Disability Age Over 75
Demographics Similar to Immigrants from Burma/Myanmar by Disability Age Over 75
In terms of disability age over 75, the demographic groups most similar to Immigrants from Burma/Myanmar are Panamanian (47.9%, a difference of 0.0%), Vietnamese (47.9%, a difference of 0.010%), Laotian (47.9%, a difference of 0.010%), Immigrants from Barbados (47.9%, a difference of 0.060%), and Senegalese (47.9%, a difference of 0.060%).
| Demographics | Rating | Rank | Disability Age Over 75 |
| Immigrants | Ghana | 19.1 /100 | #205 | Poor 47.7% |
| Jamaicans | 19.0 /100 | #206 | Poor 47.7% |
| Immigrants | Syria | 17.4 /100 | #207 | Poor 47.8% |
| Immigrants | Senegal | 16.9 /100 | #208 | Poor 47.8% |
| Immigrants | Indonesia | 14.2 /100 | #209 | Poor 47.8% |
| Vietnamese | 11.9 /100 | #210 | Poor 47.9% |
| Panamanians | 11.8 /100 | #211 | Poor 47.9% |
| Immigrants | Burma/Myanmar | 11.7 /100 | #212 | Poor 47.9% |
| Laotians | 11.5 /100 | #213 | Poor 47.9% |
| Immigrants | Barbados | 10.7 /100 | #214 | Poor 47.9% |
| Senegalese | 10.7 /100 | #215 | Poor 47.9% |
| Immigrants | Panama | 10.2 /100 | #216 | Poor 47.9% |
| Immigrants | Grenada | 9.4 /100 | #217 | Tragic 47.9% |
| Immigrants | Western Africa | 8.3 /100 | #218 | Tragic 48.0% |
| Immigrants | Western Asia | 7.5 /100 | #219 | Tragic 48.0% |
Demographics Similar to Inupiat by Disability Age Over 75
In terms of disability age over 75, the demographic groups most similar to Inupiat are Navajo (58.3%, a difference of 0.20%), Tsimshian (59.2%, a difference of 1.4%), Tohono O'odham (56.7%, a difference of 3.0%), Lumbee (56.2%, a difference of 3.8%), and Houma (56.2%, a difference of 4.0%).
| Demographics | Rating | Rank | Disability Age Over 75 |
| Apache | 0.0 /100 | #333 | Tragic 53.6% |
| Alaskan Athabascans | 0.0 /100 | #334 | Tragic 54.0% |
| Kiowa | 0.0 /100 | #335 | Tragic 54.2% |
| Immigrants | Armenia | 0.0 /100 | #336 | Tragic 54.3% |
| Yuman | 0.0 /100 | #337 | Tragic 54.4% |
| Colville | 0.0 /100 | #338 | Tragic 55.4% |
| Pima | 0.0 /100 | #339 | Tragic 55.8% |
| Pueblo | 0.0 /100 | #340 | Tragic 55.9% |
| Houma | 0.0 /100 | #341 | Tragic 56.2% |
| Lumbee | 0.0 /100 | #342 | Tragic 56.2% |
| Tohono O'odham | 0.0 /100 | #343 | Tragic 56.7% |
| Navajo | 0.0 /100 | #344 | Tragic 58.3% |
| Inupiat | 0.0 /100 | #345 | Tragic 58.4% |
| Tsimshian | 0.0 /100 | #346 | Tragic 59.2% |
| Yup'ik | 0.0 /100 | #347 | Tragic 61.1% |