White/Caucasian vs Inupiat Female Poverty
COMPARE
White/Caucasian
Inupiat
Female Poverty
Female Poverty Comparison
Whites/Caucasians
Inupiat
13.4%
FEMALE POVERTY
54.6/ 100
METRIC RATING
171st/ 347
METRIC RANK
16.2%
FEMALE POVERTY
0.0/ 100
METRIC RATING
286th/ 347
METRIC RANK
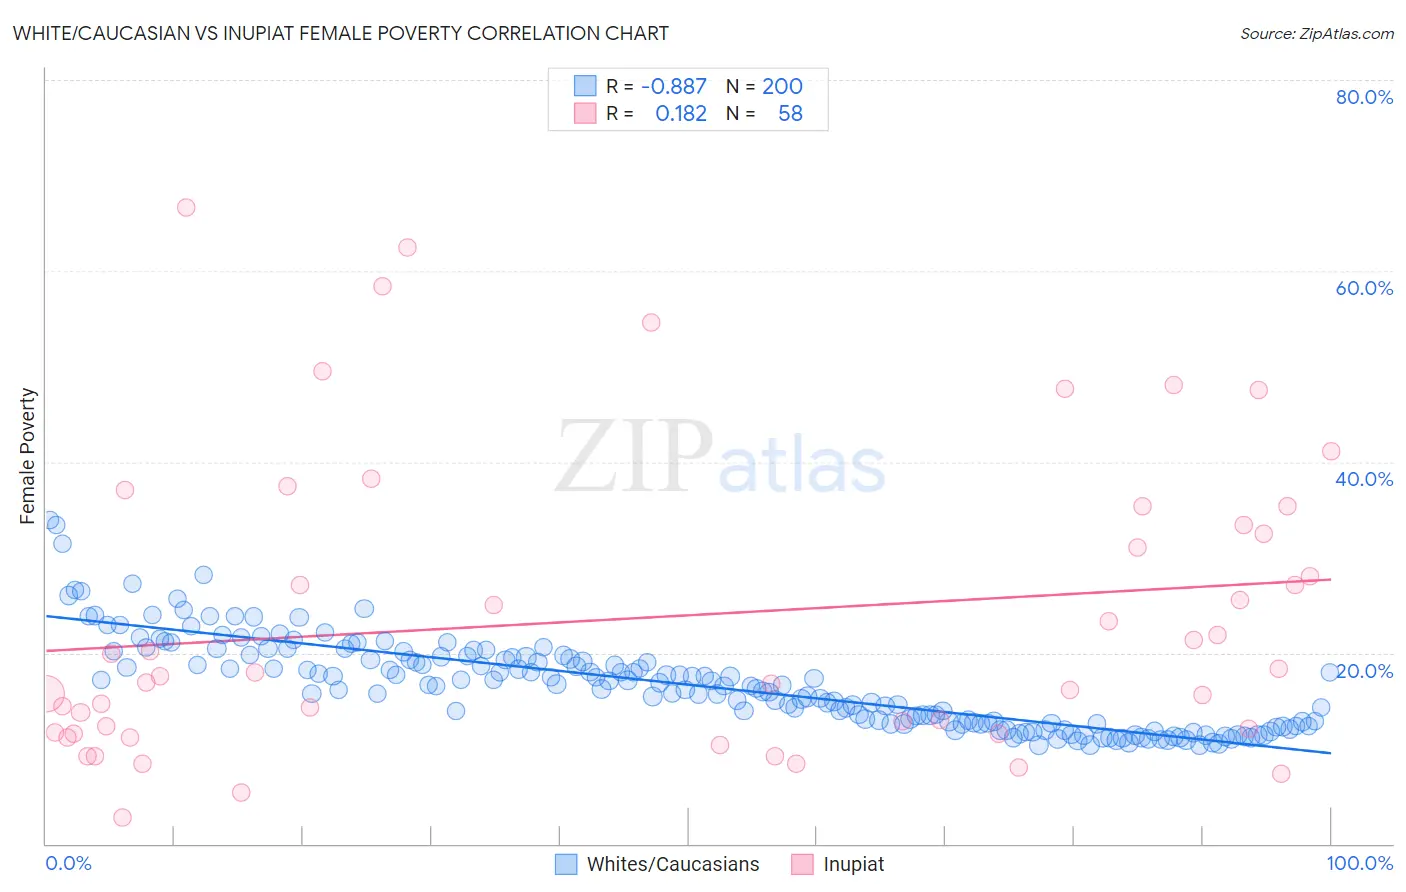
White/Caucasian vs Inupiat Female Poverty Correlation Chart
The statistical analysis conducted on geographies consisting of 583,112,868 people shows a very strong negative correlation between the proportion of Whites/Caucasians and poverty level among females in the United States with a correlation coefficient (R) of -0.887 and weighted average of 13.4%. Similarly, the statistical analysis conducted on geographies consisting of 96,314,579 people shows a poor positive correlation between the proportion of Inupiat and poverty level among females in the United States with a correlation coefficient (R) of 0.182 and weighted average of 16.2%, a difference of 21.4%.
Female Poverty Correlation Summary
| Measurement | White/Caucasian | Inupiat |
| Minimum | 10.3% | 2.8% |
| Maximum | 33.9% | 66.7% |
| Range | 23.6% | 63.9% |
| Mean | 16.7% | 23.7% |
| Median | 16.5% | 17.7% |
| Interquartile 25% (IQ1) | 12.6% | 11.6% |
| Interquartile 75% (IQ3) | 19.6% | 33.3% |
| Interquartile Range (IQR) | 7.0% | 21.7% |
| Standard Deviation (Sample) | 4.7% | 15.6% |
| Standard Deviation (Population) | 4.7% | 15.5% |
Similar Demographics by Female Poverty
Demographics Similar to Whites/Caucasians by Female Poverty
In terms of female poverty, the demographic groups most similar to Whites/Caucasians are Mongolian (13.4%, a difference of 0.10%), Colombian (13.4%, a difference of 0.11%), Lebanese (13.4%, a difference of 0.13%), Aleut (13.4%, a difference of 0.21%), and Immigrants from Chile (13.3%, a difference of 0.27%).
| Demographics | Rating | Rank | Female Poverty |
| Ethiopians | 62.3 /100 | #164 | Good 13.3% |
| Scotch-Irish | 62.1 /100 | #165 | Good 13.3% |
| Immigrants | Oceania | 59.7 /100 | #166 | Average 13.3% |
| Immigrants | Chile | 57.4 /100 | #167 | Average 13.3% |
| Aleuts | 56.7 /100 | #168 | Average 13.4% |
| Lebanese | 55.9 /100 | #169 | Average 13.4% |
| Colombians | 55.7 /100 | #170 | Average 13.4% |
| Whites/Caucasians | 54.6 /100 | #171 | Average 13.4% |
| Mongolians | 53.6 /100 | #172 | Average 13.4% |
| Immigrants | Afghanistan | 50.8 /100 | #173 | Average 13.4% |
| Immigrants | Iraq | 50.0 /100 | #174 | Average 13.4% |
| Celtics | 49.9 /100 | #175 | Average 13.4% |
| Immigrants | Spain | 49.9 /100 | #176 | Average 13.4% |
| Immigrants | Morocco | 49.4 /100 | #177 | Average 13.4% |
| Israelis | 49.1 /100 | #178 | Average 13.5% |
Demographics Similar to Inupiat by Female Poverty
In terms of female poverty, the demographic groups most similar to Inupiat are Immigrants from Belize (16.3%, a difference of 0.19%), Comanche (16.2%, a difference of 0.44%), Spanish American (16.2%, a difference of 0.52%), Immigrants from Cuba (16.1%, a difference of 0.57%), and Immigrants from Haiti (16.1%, a difference of 0.65%).
| Demographics | Rating | Rank | Female Poverty |
| Immigrants | Bahamas | 0.0 /100 | #279 | Tragic 16.1% |
| Vietnamese | 0.0 /100 | #280 | Tragic 16.1% |
| West Indians | 0.0 /100 | #281 | Tragic 16.1% |
| Immigrants | Haiti | 0.0 /100 | #282 | Tragic 16.1% |
| Immigrants | Cuba | 0.0 /100 | #283 | Tragic 16.1% |
| Spanish Americans | 0.0 /100 | #284 | Tragic 16.2% |
| Comanche | 0.0 /100 | #285 | Tragic 16.2% |
| Inupiat | 0.0 /100 | #286 | Tragic 16.2% |
| Immigrants | Belize | 0.0 /100 | #287 | Tragic 16.3% |
| Indonesians | 0.0 /100 | #288 | Tragic 16.4% |
| Blackfeet | 0.0 /100 | #289 | Tragic 16.4% |
| Immigrants | Bangladesh | 0.0 /100 | #290 | Tragic 16.4% |
| Yaqui | 0.0 /100 | #291 | Tragic 16.4% |
| Immigrants | Zaire | 0.0 /100 | #292 | Tragic 16.4% |
| Immigrants | Latin America | 0.0 /100 | #293 | Tragic 16.4% |