White/Caucasian vs Paiute Disability Age Over 75
COMPARE
White/Caucasian
Paiute
Disability Age Over 75
Disability Age Over 75 Comparison
Whites/Caucasians
Paiute
47.3%
DISABILITY AGE OVER 75
50.0/ 100
METRIC RATING
174th/ 347
METRIC RANK
51.5%
DISABILITY AGE OVER 75
0.0/ 100
METRIC RATING
320th/ 347
METRIC RANK
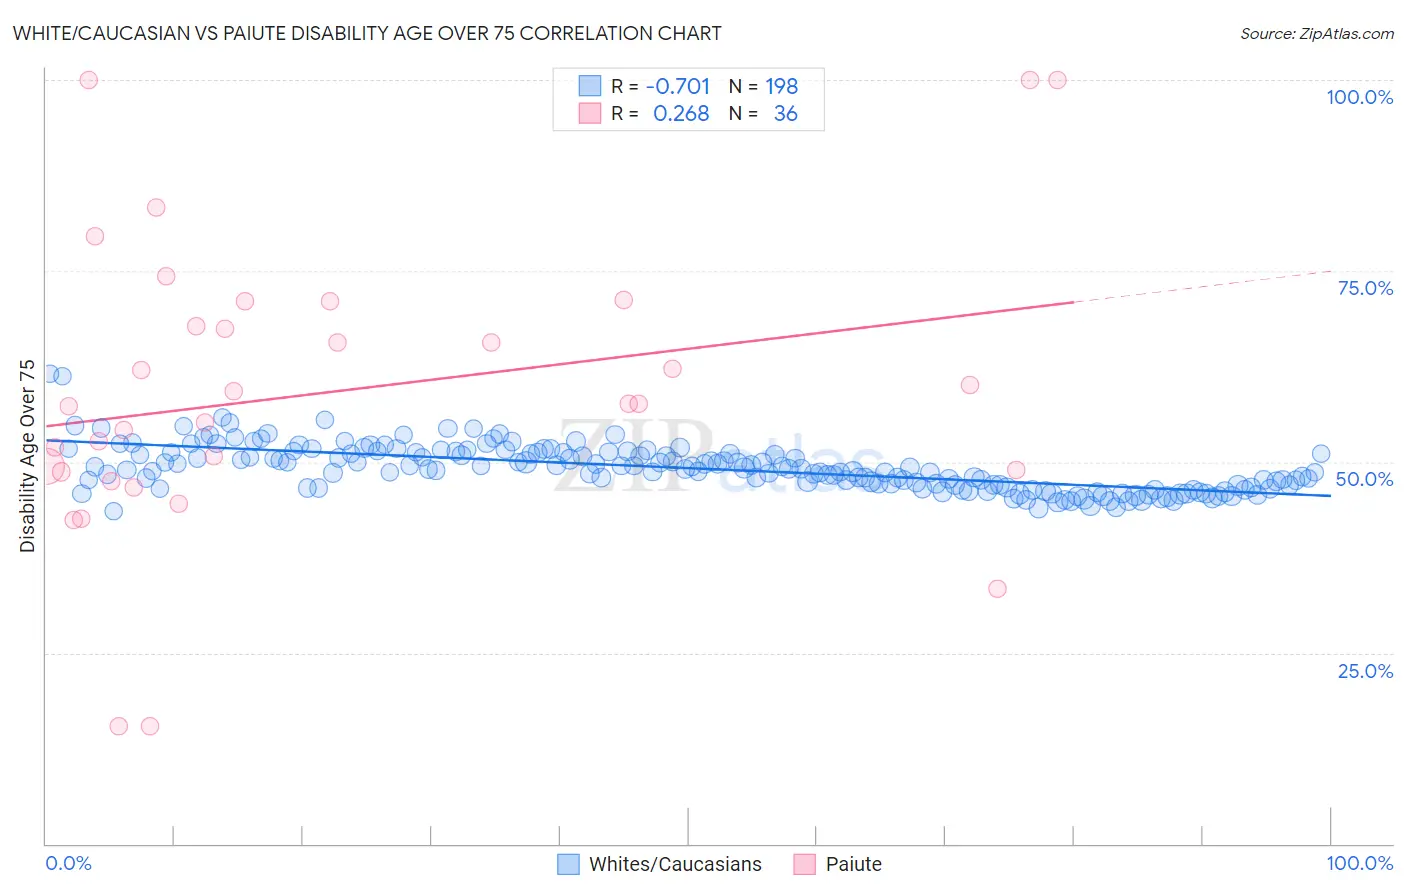
White/Caucasian vs Paiute Disability Age Over 75 Correlation Chart
The statistical analysis conducted on geographies consisting of 580,540,031 people shows a strong negative correlation between the proportion of Whites/Caucasians and percentage of population with a disability over the age of 75 in the United States with a correlation coefficient (R) of -0.701 and weighted average of 47.3%. Similarly, the statistical analysis conducted on geographies consisting of 58,388,760 people shows a weak positive correlation between the proportion of Paiute and percentage of population with a disability over the age of 75 in the United States with a correlation coefficient (R) of 0.268 and weighted average of 51.5%, a difference of 8.8%.
Disability Age Over 75 Correlation Summary
| Measurement | White/Caucasian | Paiute |
| Minimum | 43.5% | 15.4% |
| Maximum | 61.5% | 100.0% |
| Range | 18.0% | 84.6% |
| Mean | 49.2% | 59.2% |
| Median | 49.0% | 57.7% |
| Interquartile 25% (IQ1) | 46.7% | 48.8% |
| Interquartile 75% (IQ3) | 51.2% | 69.4% |
| Interquartile Range (IQR) | 4.5% | 20.6% |
| Standard Deviation (Sample) | 3.0% | 19.3% |
| Standard Deviation (Population) | 3.0% | 19.0% |
Similar Demographics by Disability Age Over 75
Demographics Similar to Whites/Caucasians by Disability Age Over 75
In terms of disability age over 75, the demographic groups most similar to Whites/Caucasians are Immigrants from Haiti (47.3%, a difference of 0.010%), Alsatian (47.3%, a difference of 0.040%), Scotch-Irish (47.3%, a difference of 0.060%), Ecuadorian (47.4%, a difference of 0.070%), and Immigrants from Africa (47.3%, a difference of 0.080%).
| Demographics | Rating | Rank | Disability Age Over 75 |
| Moroccans | 62.9 /100 | #167 | Good 47.2% |
| Kenyans | 58.8 /100 | #168 | Average 47.2% |
| Celtics | 58.7 /100 | #169 | Average 47.2% |
| German Russians | 56.2 /100 | #170 | Average 47.3% |
| Immigrants | Africa | 53.6 /100 | #171 | Average 47.3% |
| Scotch-Irish | 52.5 /100 | #172 | Average 47.3% |
| Alsatians | 51.9 /100 | #173 | Average 47.3% |
| Whites/Caucasians | 50.0 /100 | #174 | Average 47.3% |
| Immigrants | Haiti | 49.7 /100 | #175 | Average 47.3% |
| Ecuadorians | 46.7 /100 | #176 | Average 47.4% |
| Haitians | 44.6 /100 | #177 | Average 47.4% |
| Cubans | 42.1 /100 | #178 | Average 47.4% |
| Sierra Leoneans | 41.7 /100 | #179 | Average 47.4% |
| Immigrants | Ecuador | 41.7 /100 | #180 | Average 47.4% |
| Immigrants | Kazakhstan | 40.4 /100 | #181 | Average 47.4% |
Demographics Similar to Paiute by Disability Age Over 75
In terms of disability age over 75, the demographic groups most similar to Paiute are Dutch West Indian (51.5%, a difference of 0.0%), Seminole (51.5%, a difference of 0.14%), Creek (51.5%, a difference of 0.14%), Comanche (51.7%, a difference of 0.34%), and Yakama (51.3%, a difference of 0.47%).
| Demographics | Rating | Rank | Disability Age Over 75 |
| Immigrants | Azores | 0.0 /100 | #313 | Tragic 50.9% |
| Immigrants | Mexico | 0.0 /100 | #314 | Tragic 51.1% |
| Mexicans | 0.0 /100 | #315 | Tragic 51.1% |
| Chickasaw | 0.0 /100 | #316 | Tragic 51.2% |
| Yakama | 0.0 /100 | #317 | Tragic 51.3% |
| Seminole | 0.0 /100 | #318 | Tragic 51.5% |
| Creek | 0.0 /100 | #319 | Tragic 51.5% |
| Paiute | 0.0 /100 | #320 | Tragic 51.5% |
| Dutch West Indians | 0.0 /100 | #321 | Tragic 51.5% |
| Comanche | 0.0 /100 | #322 | Tragic 51.7% |
| Immigrants | Yemen | 0.0 /100 | #323 | Tragic 52.0% |
| Menominee | 0.0 /100 | #324 | Tragic 52.3% |
| Immigrants | Cabo Verde | 0.0 /100 | #325 | Tragic 52.4% |
| Ute | 0.0 /100 | #326 | Tragic 52.6% |
| Nepalese | 0.0 /100 | #327 | Tragic 52.6% |