Slovak vs Inupiat Disability Age Over 75
COMPARE
Slovak
Inupiat
Disability Age Over 75
Disability Age Over 75 Comparison
Slovaks
Inupiat
45.8%
DISABILITY AGE OVER 75
99.6/ 100
METRIC RATING
54th/ 347
METRIC RANK
58.4%
DISABILITY AGE OVER 75
0.0/ 100
METRIC RATING
345th/ 347
METRIC RANK
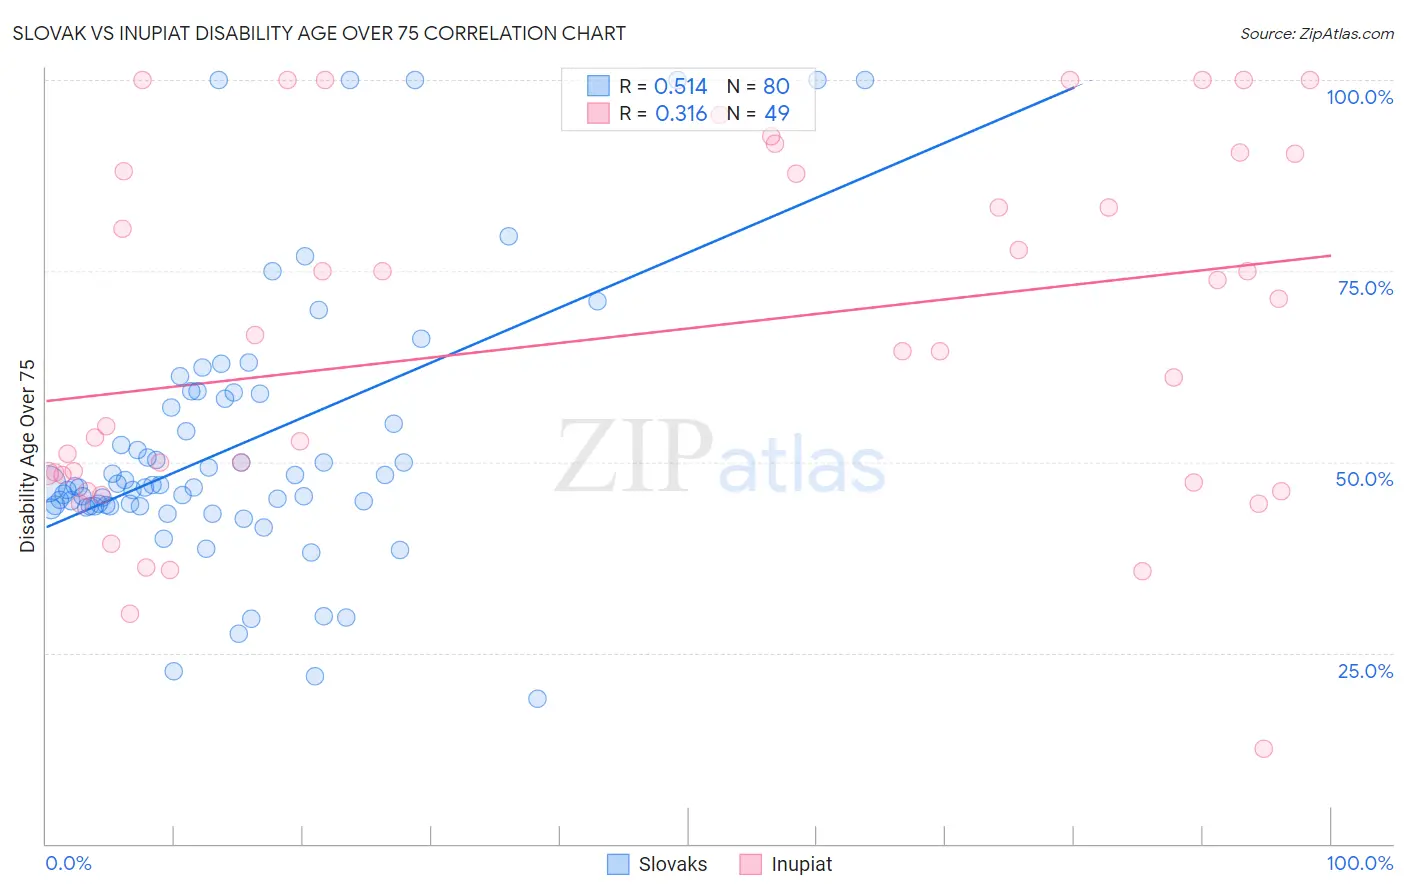
Slovak vs Inupiat Disability Age Over 75 Correlation Chart
The statistical analysis conducted on geographies consisting of 397,228,440 people shows a substantial positive correlation between the proportion of Slovaks and percentage of population with a disability over the age of 75 in the United States with a correlation coefficient (R) of 0.514 and weighted average of 45.8%. Similarly, the statistical analysis conducted on geographies consisting of 96,244,467 people shows a mild positive correlation between the proportion of Inupiat and percentage of population with a disability over the age of 75 in the United States with a correlation coefficient (R) of 0.316 and weighted average of 58.4%, a difference of 27.4%.
Disability Age Over 75 Correlation Summary
| Measurement | Slovak | Inupiat |
| Minimum | 19.0% | 12.5% |
| Maximum | 100.0% | 100.0% |
| Range | 81.0% | 87.5% |
| Mean | 52.1% | 66.5% |
| Median | 46.9% | 64.5% |
| Interquartile 25% (IQ1) | 44.2% | 47.8% |
| Interquartile 75% (IQ3) | 58.6% | 89.2% |
| Interquartile Range (IQR) | 14.4% | 41.4% |
| Standard Deviation (Sample) | 17.7% | 23.4% |
| Standard Deviation (Population) | 17.6% | 23.2% |
Similar Demographics by Disability Age Over 75
Demographics Similar to Slovaks by Disability Age Over 75
In terms of disability age over 75, the demographic groups most similar to Slovaks are Maltese (45.8%, a difference of 0.0%), Immigrants from Netherlands (45.9%, a difference of 0.070%), Immigrants from Italy (45.8%, a difference of 0.080%), Immigrants from Turkey (45.9%, a difference of 0.080%), and Immigrants from France (45.8%, a difference of 0.090%).
| Demographics | Rating | Rank | Disability Age Over 75 |
| Immigrants | Canada | 99.8 /100 | #47 | Exceptional 45.7% |
| Croatians | 99.8 /100 | #48 | Exceptional 45.7% |
| Immigrants | North America | 99.8 /100 | #49 | Exceptional 45.7% |
| Belgians | 99.7 /100 | #50 | Exceptional 45.8% |
| Immigrants | Korea | 99.7 /100 | #51 | Exceptional 45.8% |
| Immigrants | France | 99.7 /100 | #52 | Exceptional 45.8% |
| Immigrants | Italy | 99.7 /100 | #53 | Exceptional 45.8% |
| Slovaks | 99.6 /100 | #54 | Exceptional 45.8% |
| Maltese | 99.6 /100 | #55 | Exceptional 45.8% |
| Immigrants | Netherlands | 99.6 /100 | #56 | Exceptional 45.9% |
| Immigrants | Turkey | 99.6 /100 | #57 | Exceptional 45.9% |
| Immigrants | Israel | 99.6 /100 | #58 | Exceptional 45.9% |
| Iranians | 99.6 /100 | #59 | Exceptional 45.9% |
| Immigrants | Europe | 99.6 /100 | #60 | Exceptional 45.9% |
| Immigrants | Argentina | 99.6 /100 | #61 | Exceptional 45.9% |
Demographics Similar to Inupiat by Disability Age Over 75
In terms of disability age over 75, the demographic groups most similar to Inupiat are Navajo (58.3%, a difference of 0.20%), Tsimshian (59.2%, a difference of 1.4%), Tohono O'odham (56.7%, a difference of 3.0%), Lumbee (56.2%, a difference of 3.8%), and Houma (56.2%, a difference of 4.0%).
| Demographics | Rating | Rank | Disability Age Over 75 |
| Apache | 0.0 /100 | #333 | Tragic 53.6% |
| Alaskan Athabascans | 0.0 /100 | #334 | Tragic 54.0% |
| Kiowa | 0.0 /100 | #335 | Tragic 54.2% |
| Immigrants | Armenia | 0.0 /100 | #336 | Tragic 54.3% |
| Yuman | 0.0 /100 | #337 | Tragic 54.4% |
| Colville | 0.0 /100 | #338 | Tragic 55.4% |
| Pima | 0.0 /100 | #339 | Tragic 55.8% |
| Pueblo | 0.0 /100 | #340 | Tragic 55.9% |
| Houma | 0.0 /100 | #341 | Tragic 56.2% |
| Lumbee | 0.0 /100 | #342 | Tragic 56.2% |
| Tohono O'odham | 0.0 /100 | #343 | Tragic 56.7% |
| Navajo | 0.0 /100 | #344 | Tragic 58.3% |
| Inupiat | 0.0 /100 | #345 | Tragic 58.4% |
| Tsimshian | 0.0 /100 | #346 | Tragic 59.2% |
| Yup'ik | 0.0 /100 | #347 | Tragic 61.1% |