Subsaharan African vs Samoan In Labor Force | Age 16-19
COMPARE
Subsaharan African
Samoan
In Labor Force | Age 16-19
In Labor Force | Age 16-19 Comparison
Sub-Saharan Africans
Samoans
38.4%
IN LABOR FORCE | AGE 16-19
98.3/ 100
METRIC RATING
113th/ 347
METRIC RANK
39.1%
IN LABOR FORCE | AGE 16-19
99.6/ 100
METRIC RATING
86th/ 347
METRIC RANK
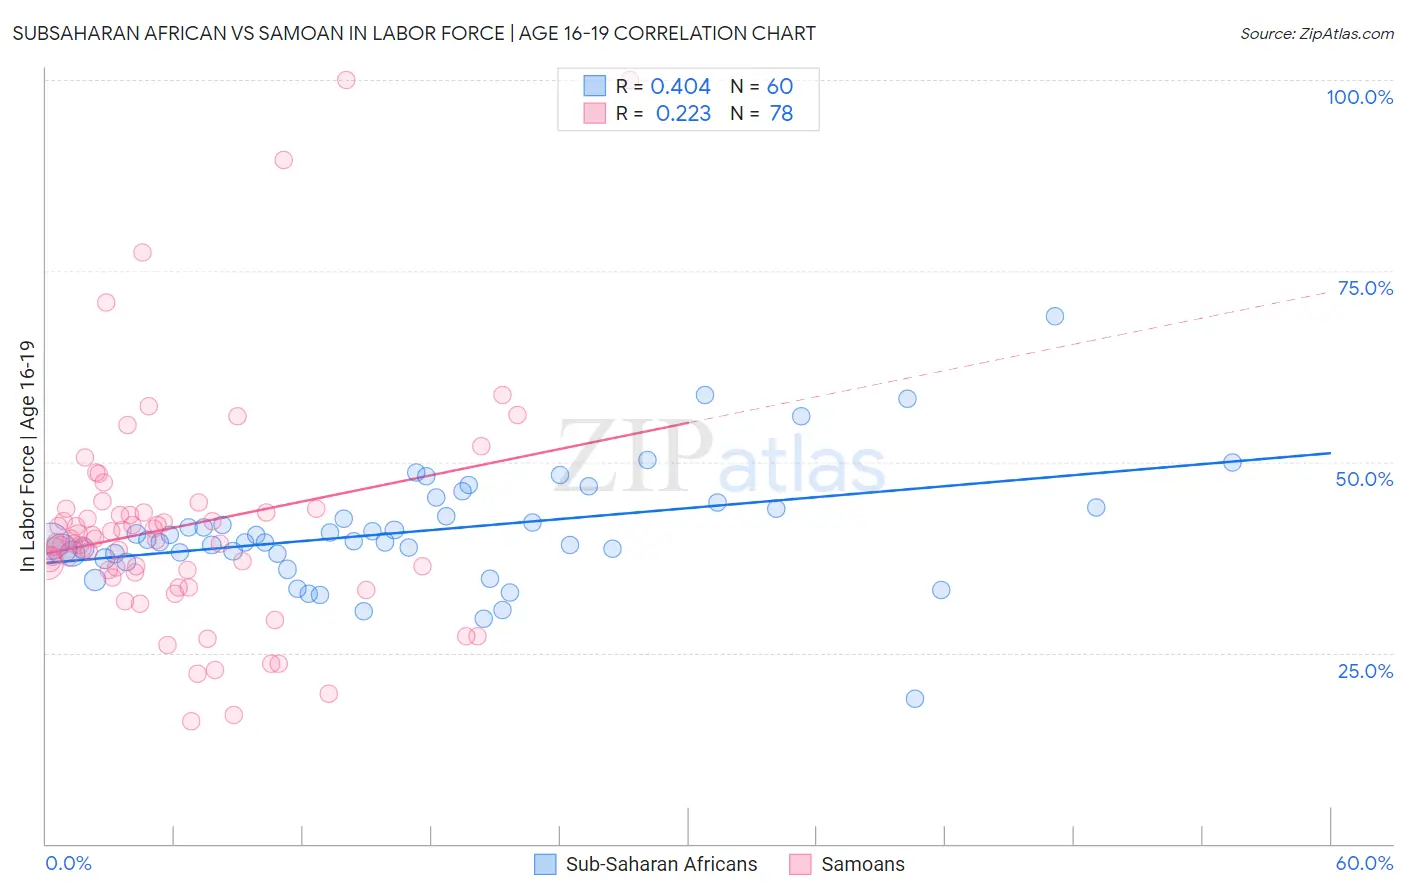
Subsaharan African vs Samoan In Labor Force | Age 16-19 Correlation Chart
The statistical analysis conducted on geographies consisting of 506,892,263 people shows a moderate positive correlation between the proportion of Sub-Saharan Africans and labor force participation rate among population between the ages 16 and 19 in the United States with a correlation coefficient (R) of 0.404 and weighted average of 38.4%. Similarly, the statistical analysis conducted on geographies consisting of 225,011,822 people shows a weak positive correlation between the proportion of Samoans and labor force participation rate among population between the ages 16 and 19 in the United States with a correlation coefficient (R) of 0.223 and weighted average of 39.1%, a difference of 1.8%.
In Labor Force | Age 16-19 Correlation Summary
| Measurement | Subsaharan African | Samoan |
| Minimum | 19.0% | 16.0% |
| Maximum | 69.1% | 100.0% |
| Range | 50.1% | 84.0% |
| Mean | 40.9% | 41.6% |
| Median | 39.6% | 39.5% |
| Interquartile 25% (IQ1) | 37.9% | 35.5% |
| Interquartile 75% (IQ3) | 44.0% | 43.3% |
| Interquartile Range (IQR) | 6.0% | 7.9% |
| Standard Deviation (Sample) | 7.7% | 15.2% |
| Standard Deviation (Population) | 7.6% | 15.1% |
Similar Demographics by In Labor Force | Age 16-19
Demographics Similar to Sub-Saharan Africans by In Labor Force | Age 16-19
In terms of in labor force | age 16-19, the demographic groups most similar to Sub-Saharan Africans are Hawaiian (38.4%, a difference of 0.10%), Immigrants from Scotland (38.5%, a difference of 0.13%), Crow (38.5%, a difference of 0.14%), Maltese (38.5%, a difference of 0.20%), and Bulgarian (38.3%, a difference of 0.24%).
| Demographics | Rating | Rank | In Labor Force | Age 16-19 |
| Delaware | 98.8 /100 | #106 | Exceptional 38.6% |
| Chinese | 98.8 /100 | #107 | Exceptional 38.6% |
| Immigrants | Ethiopia | 98.7 /100 | #108 | Exceptional 38.6% |
| Lebanese | 98.7 /100 | #109 | Exceptional 38.6% |
| Maltese | 98.6 /100 | #110 | Exceptional 38.5% |
| Crow | 98.5 /100 | #111 | Exceptional 38.5% |
| Immigrants | Scotland | 98.5 /100 | #112 | Exceptional 38.5% |
| Sub-Saharan Africans | 98.3 /100 | #113 | Exceptional 38.4% |
| Hawaiians | 98.2 /100 | #114 | Exceptional 38.4% |
| Bulgarians | 97.9 /100 | #115 | Exceptional 38.3% |
| Colville | 97.9 /100 | #116 | Exceptional 38.3% |
| Chickasaw | 97.8 /100 | #117 | Exceptional 38.3% |
| Immigrants | Nepal | 97.8 /100 | #118 | Exceptional 38.3% |
| Assyrians/Chaldeans/Syriacs | 97.8 /100 | #119 | Exceptional 38.3% |
| Ukrainians | 97.6 /100 | #120 | Exceptional 38.3% |
Demographics Similar to Samoans by In Labor Force | Age 16-19
In terms of in labor force | age 16-19, the demographic groups most similar to Samoans are Creek (39.1%, a difference of 0.020%), Immigrants from Germany (39.1%, a difference of 0.080%), Puget Sound Salish (39.1%, a difference of 0.16%), Alaska Native (39.1%, a difference of 0.16%), and Immigrants from Uganda (39.2%, a difference of 0.17%).
| Demographics | Rating | Rank | In Labor Force | Age 16-19 |
| Marshallese | 99.8 /100 | #79 | Exceptional 39.5% |
| Immigrants | Iraq | 99.8 /100 | #80 | Exceptional 39.4% |
| Shoshone | 99.7 /100 | #81 | Exceptional 39.3% |
| Basques | 99.7 /100 | #82 | Exceptional 39.3% |
| Spanish | 99.7 /100 | #83 | Exceptional 39.3% |
| Immigrants | Uganda | 99.7 /100 | #84 | Exceptional 39.2% |
| Creek | 99.6 /100 | #85 | Exceptional 39.1% |
| Samoans | 99.6 /100 | #86 | Exceptional 39.1% |
| Immigrants | Germany | 99.6 /100 | #87 | Exceptional 39.1% |
| Puget Sound Salish | 99.6 /100 | #88 | Exceptional 39.1% |
| Alaska Natives | 99.6 /100 | #89 | Exceptional 39.1% |
| Immigrants | Burma/Myanmar | 99.5 /100 | #90 | Exceptional 39.0% |
| Spanish Americans | 99.5 /100 | #91 | Exceptional 39.0% |
| Osage | 99.4 /100 | #92 | Exceptional 39.0% |
| Blackfeet | 99.4 /100 | #93 | Exceptional 38.9% |