Subsaharan African vs Samoan Child Poverty Among Girls Under 16
COMPARE
Subsaharan African
Samoan
Child Poverty Among Girls Under 16
Child Poverty Among Girls Under 16 Comparison
Sub-Saharan Africans
Samoans
20.1%
CHILD POVERTY AMONG GIRLS UNDER 16
0.0/ 100
METRIC RATING
275th/ 347
METRIC RANK
15.7%
CHILD POVERTY AMONG GIRLS UNDER 16
84.2/ 100
METRIC RATING
146th/ 347
METRIC RANK
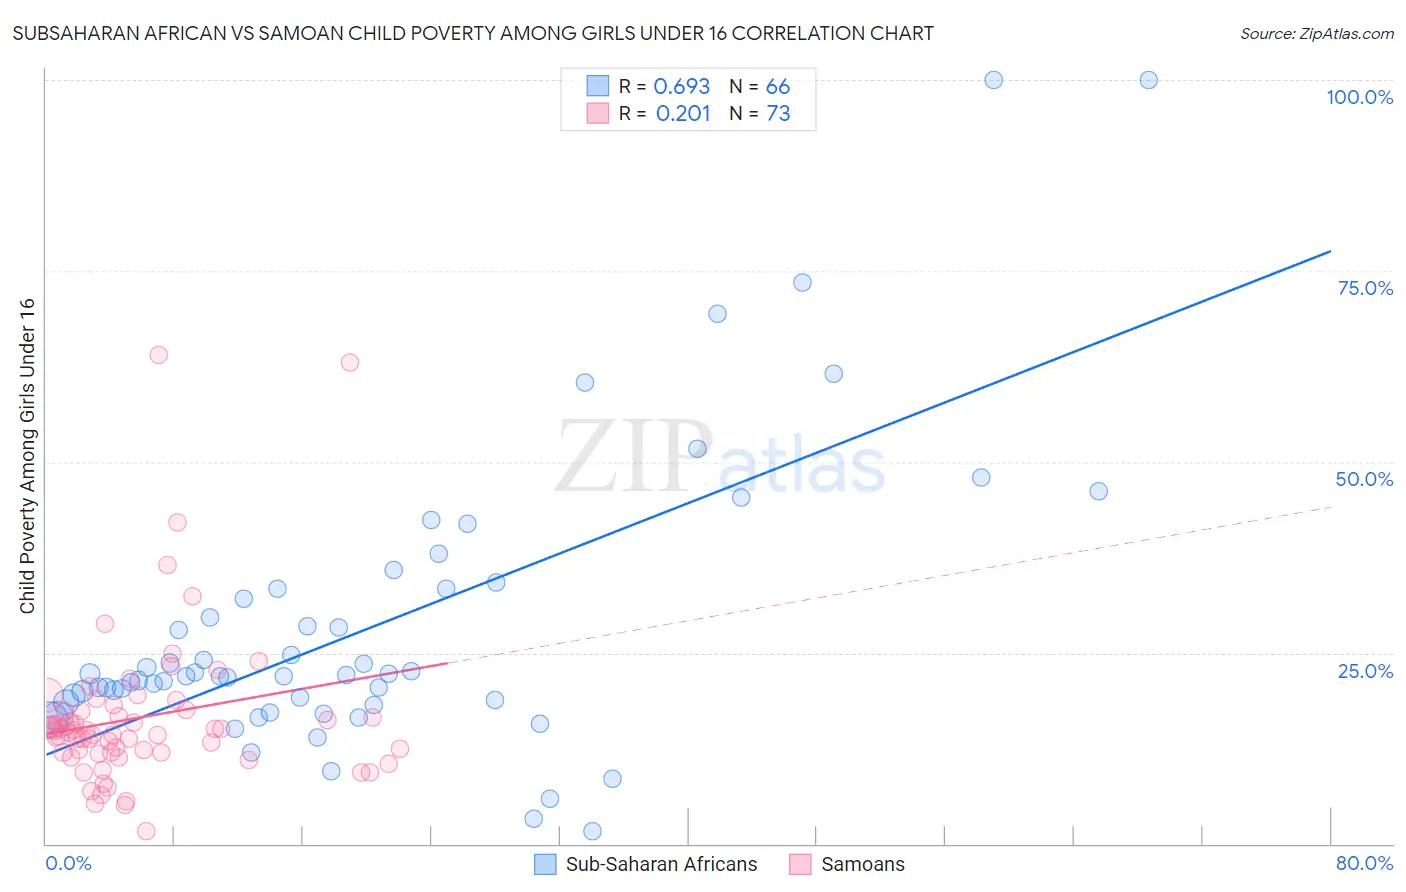
Subsaharan African vs Samoan Child Poverty Among Girls Under 16 Correlation Chart
The statistical analysis conducted on geographies consisting of 496,899,151 people shows a significant positive correlation between the proportion of Sub-Saharan Africans and poverty level among girls under the age of 16 in the United States with a correlation coefficient (R) of 0.693 and weighted average of 20.1%. Similarly, the statistical analysis conducted on geographies consisting of 223,807,400 people shows a weak positive correlation between the proportion of Samoans and poverty level among girls under the age of 16 in the United States with a correlation coefficient (R) of 0.201 and weighted average of 15.7%, a difference of 28.3%.
Child Poverty Among Girls Under 16 Correlation Summary
| Measurement | Subsaharan African | Samoan |
| Minimum | 1.7% | 1.7% |
| Maximum | 100.0% | 64.0% |
| Range | 98.3% | 62.3% |
| Mean | 28.3% | 16.5% |
| Median | 21.9% | 14.8% |
| Interquartile 25% (IQ1) | 18.5% | 11.9% |
| Interquartile 75% (IQ3) | 33.3% | 17.5% |
| Interquartile Range (IQR) | 14.8% | 5.5% |
| Standard Deviation (Sample) | 19.2% | 10.3% |
| Standard Deviation (Population) | 19.1% | 10.3% |
Similar Demographics by Child Poverty Among Girls Under 16
Demographics Similar to Sub-Saharan Africans by Child Poverty Among Girls Under 16
In terms of child poverty among girls under 16, the demographic groups most similar to Sub-Saharan Africans are Immigrants from St. Vincent and the Grenadines (20.1%, a difference of 0.14%), Comanche (20.2%, a difference of 0.32%), Belizean (20.2%, a difference of 0.43%), Barbadian (20.2%, a difference of 0.46%), and Bangladeshi (20.0%, a difference of 0.57%).
| Demographics | Rating | Rank | Child Poverty Among Girls Under 16 |
| Spanish American Indians | 0.1 /100 | #268 | Tragic 19.9% |
| Liberians | 0.1 /100 | #269 | Tragic 19.9% |
| Cherokee | 0.1 /100 | #270 | Tragic 19.9% |
| Immigrants | Barbados | 0.1 /100 | #271 | Tragic 19.9% |
| Immigrants | El Salvador | 0.1 /100 | #272 | Tragic 20.0% |
| Bangladeshis | 0.1 /100 | #273 | Tragic 20.0% |
| Immigrants | St. Vincent and the Grenadines | 0.0 /100 | #274 | Tragic 20.1% |
| Sub-Saharan Africans | 0.0 /100 | #275 | Tragic 20.1% |
| Comanche | 0.0 /100 | #276 | Tragic 20.2% |
| Belizeans | 0.0 /100 | #277 | Tragic 20.2% |
| Barbadians | 0.0 /100 | #278 | Tragic 20.2% |
| Immigrants | Zaire | 0.0 /100 | #279 | Tragic 20.2% |
| Immigrants | Liberia | 0.0 /100 | #280 | Tragic 20.2% |
| Central Americans | 0.0 /100 | #281 | Tragic 20.2% |
| West Indians | 0.0 /100 | #282 | Tragic 20.3% |
Demographics Similar to Samoans by Child Poverty Among Girls Under 16
In terms of child poverty among girls under 16, the demographic groups most similar to Samoans are Slavic (15.7%, a difference of 0.23%), Welsh (15.6%, a difference of 0.29%), Icelander (15.7%, a difference of 0.38%), Israeli (15.6%, a difference of 0.50%), and Immigrants from Peru (15.6%, a difference of 0.59%).
| Demographics | Rating | Rank | Child Poverty Among Girls Under 16 |
| Armenians | 87.9 /100 | #139 | Excellent 15.5% |
| New Zealanders | 87.2 /100 | #140 | Excellent 15.6% |
| Immigrants | Jordan | 87.2 /100 | #141 | Excellent 15.6% |
| Canadians | 87.1 /100 | #142 | Excellent 15.6% |
| Immigrants | Peru | 86.6 /100 | #143 | Excellent 15.6% |
| Israelis | 86.3 /100 | #144 | Excellent 15.6% |
| Welsh | 85.4 /100 | #145 | Excellent 15.6% |
| Samoans | 84.2 /100 | #146 | Excellent 15.7% |
| Slavs | 83.1 /100 | #147 | Excellent 15.7% |
| Icelanders | 82.4 /100 | #148 | Excellent 15.7% |
| Immigrants | Hungary | 80.9 /100 | #149 | Excellent 15.8% |
| Immigrants | Albania | 80.7 /100 | #150 | Excellent 15.8% |
| Venezuelans | 80.1 /100 | #151 | Excellent 15.8% |
| Immigrants | Kuwait | 79.4 /100 | #152 | Good 15.8% |
| Immigrants | Nepal | 78.5 /100 | #153 | Good 15.9% |