Subsaharan African vs Romanian Unemployment Among Ages 20 to 24 years
COMPARE
Subsaharan African
Romanian
Unemployment Among Ages 20 to 24 years
Unemployment Among Ages 20 to 24 years Comparison
Sub-Saharan Africans
Romanians
11.1%
UNEMPLOYMENT AMONG AGES 20 TO 24 YEARS
0.0/ 100
METRIC RATING
264th/ 347
METRIC RANK
10.2%
UNEMPLOYMENT AMONG AGES 20 TO 24 YEARS
83.8/ 100
METRIC RATING
134th/ 347
METRIC RANK
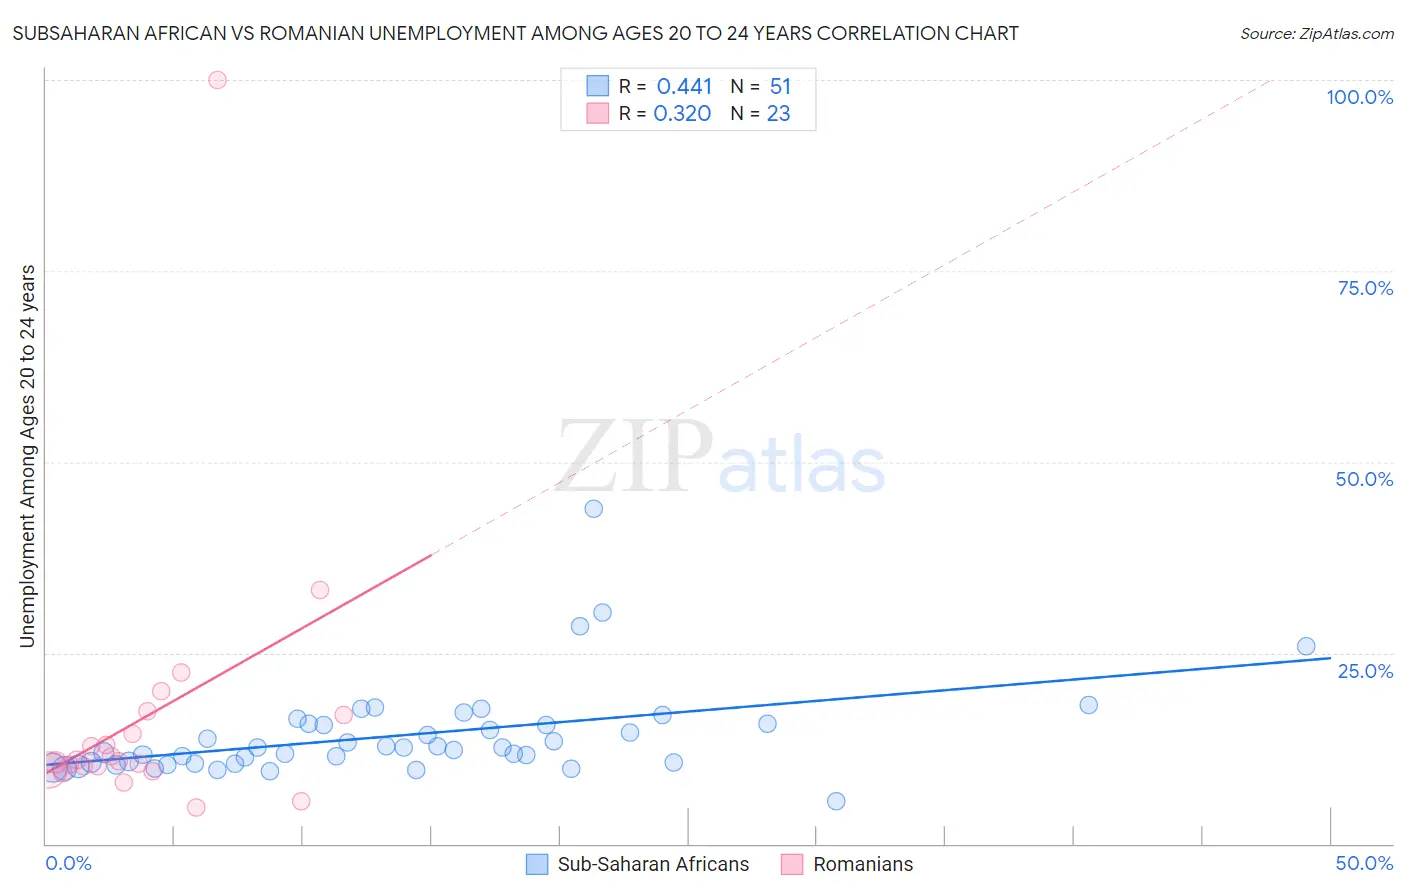
Subsaharan African vs Romanian Unemployment Among Ages 20 to 24 years Correlation Chart
The statistical analysis conducted on geographies consisting of 484,655,808 people shows a moderate positive correlation between the proportion of Sub-Saharan Africans and unemployment rate among population between the ages 20 and 24 in the United States with a correlation coefficient (R) of 0.441 and weighted average of 11.1%. Similarly, the statistical analysis conducted on geographies consisting of 366,181,336 people shows a mild positive correlation between the proportion of Romanians and unemployment rate among population between the ages 20 and 24 in the United States with a correlation coefficient (R) of 0.320 and weighted average of 10.2%, a difference of 9.1%.
Unemployment Among Ages 20 to 24 years Correlation Summary
| Measurement | Subsaharan African | Romanian |
| Minimum | 5.5% | 4.8% |
| Maximum | 43.9% | 100.0% |
| Range | 38.4% | 95.2% |
| Mean | 14.2% | 16.6% |
| Median | 12.5% | 10.8% |
| Interquartile 25% (IQ1) | 10.5% | 9.6% |
| Interquartile 75% (IQ3) | 15.7% | 16.8% |
| Interquartile Range (IQR) | 5.2% | 7.2% |
| Standard Deviation (Sample) | 6.3% | 19.2% |
| Standard Deviation (Population) | 6.2% | 18.8% |
Similar Demographics by Unemployment Among Ages 20 to 24 years
Demographics Similar to Sub-Saharan Africans by Unemployment Among Ages 20 to 24 years
In terms of unemployment among ages 20 to 24 years, the demographic groups most similar to Sub-Saharan Africans are Immigrants from Ireland (11.1%, a difference of 0.070%), Immigrants from Liberia (11.1%, a difference of 0.16%), Immigrants from Greece (11.1%, a difference of 0.44%), Marshallese (11.0%, a difference of 0.75%), and Maltese (11.2%, a difference of 0.89%).
| Demographics | Rating | Rank | Unemployment Among Ages 20 to 24 years |
| Immigrants | Western Asia | 0.3 /100 | #257 | Tragic 10.9% |
| Dutch West Indians | 0.3 /100 | #258 | Tragic 10.9% |
| Panamanians | 0.2 /100 | #259 | Tragic 10.9% |
| Immigrants | Lebanon | 0.2 /100 | #260 | Tragic 10.9% |
| Puget Sound Salish | 0.2 /100 | #261 | Tragic 10.9% |
| Immigrants | Latin America | 0.1 /100 | #262 | Tragic 11.0% |
| Marshallese | 0.1 /100 | #263 | Tragic 11.0% |
| Sub-Saharan Africans | 0.0 /100 | #264 | Tragic 11.1% |
| Immigrants | Ireland | 0.0 /100 | #265 | Tragic 11.1% |
| Immigrants | Liberia | 0.0 /100 | #266 | Tragic 11.1% |
| Immigrants | Greece | 0.0 /100 | #267 | Tragic 11.1% |
| Maltese | 0.0 /100 | #268 | Tragic 11.2% |
| Ute | 0.0 /100 | #269 | Tragic 11.2% |
| Delaware | 0.0 /100 | #270 | Tragic 11.3% |
| Immigrants | Uzbekistan | 0.0 /100 | #271 | Tragic 11.4% |
Demographics Similar to Romanians by Unemployment Among Ages 20 to 24 years
In terms of unemployment among ages 20 to 24 years, the demographic groups most similar to Romanians are Austrian (10.2%, a difference of 0.010%), Immigrants from South Eastern Asia (10.1%, a difference of 0.020%), Immigrants from Lithuania (10.1%, a difference of 0.030%), Seminole (10.1%, a difference of 0.030%), and Comanche (10.2%, a difference of 0.030%).
| Demographics | Rating | Rank | Unemployment Among Ages 20 to 24 years |
| Immigrants | Norway | 85.3 /100 | #127 | Excellent 10.1% |
| Immigrants | Brazil | 84.9 /100 | #128 | Excellent 10.1% |
| Immigrants | South Central Asia | 84.6 /100 | #129 | Excellent 10.1% |
| Immigrants | Lithuania | 84.2 /100 | #130 | Excellent 10.1% |
| Seminole | 84.2 /100 | #131 | Excellent 10.1% |
| Immigrants | South Eastern Asia | 84.0 /100 | #132 | Excellent 10.1% |
| Austrians | 83.9 /100 | #133 | Excellent 10.2% |
| Romanians | 83.8 /100 | #134 | Excellent 10.2% |
| Comanche | 83.4 /100 | #135 | Excellent 10.2% |
| Immigrants | Northern Africa | 82.5 /100 | #136 | Excellent 10.2% |
| Immigrants | North America | 82.5 /100 | #137 | Excellent 10.2% |
| Burmese | 82.3 /100 | #138 | Excellent 10.2% |
| Uruguayans | 81.9 /100 | #139 | Excellent 10.2% |
| Immigrants | Austria | 81.4 /100 | #140 | Excellent 10.2% |
| Immigrants | Azores | 81.4 /100 | #141 | Excellent 10.2% |