Subsaharan African vs Osage Child Poverty Among Boys Under 16
COMPARE
Subsaharan African
Osage
Child Poverty Among Boys Under 16
Child Poverty Among Boys Under 16 Comparison
Sub-Saharan Africans
Osage
20.0%
CHILD POVERTY AMONG BOYS UNDER 16
0.0/ 100
METRIC RATING
276th/ 347
METRIC RANK
17.7%
CHILD POVERTY AMONG BOYS UNDER 16
5.8/ 100
METRIC RATING
215th/ 347
METRIC RANK
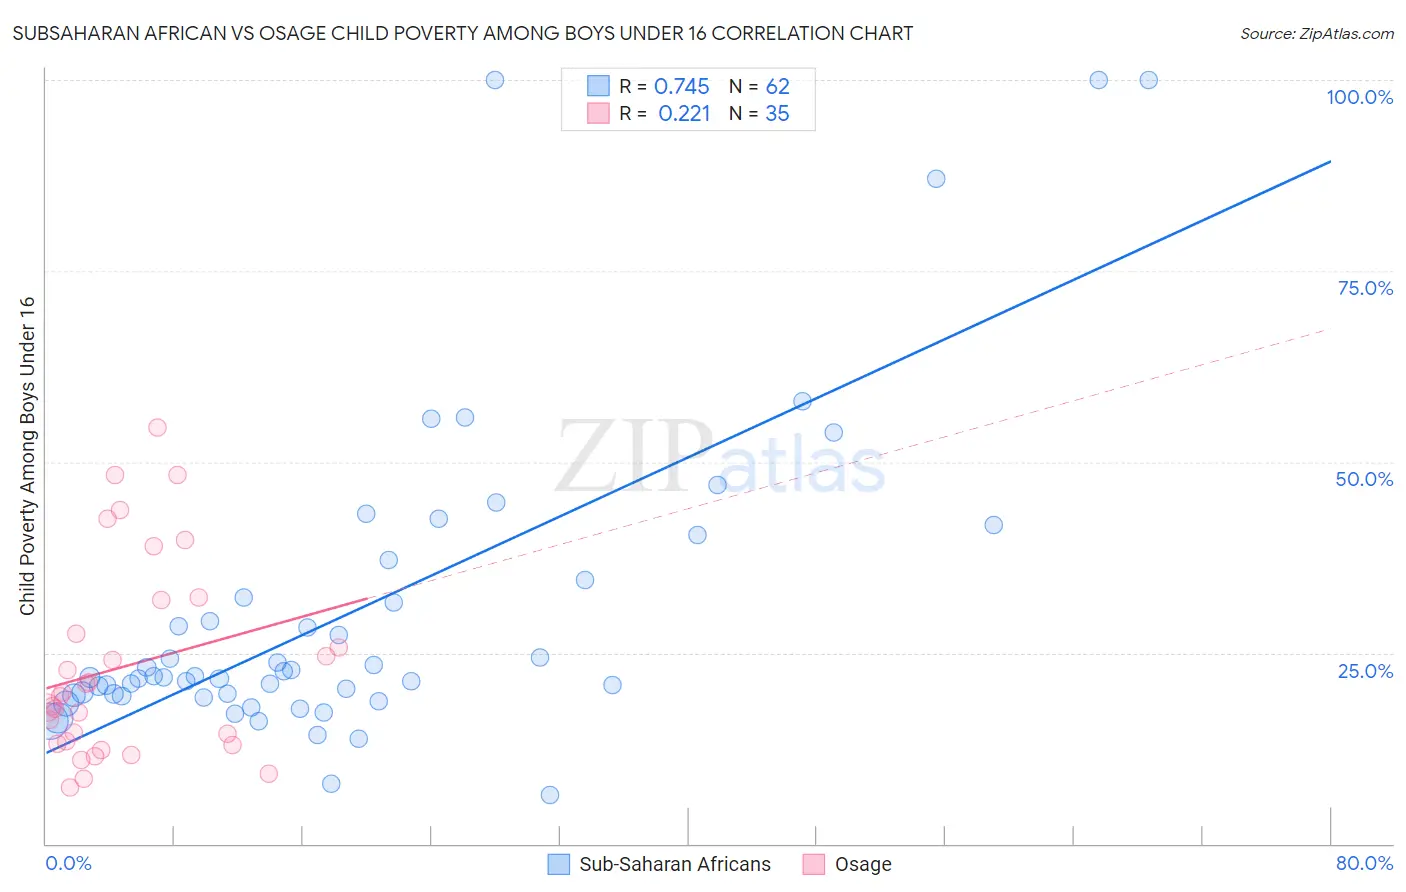
Subsaharan African vs Osage Child Poverty Among Boys Under 16 Correlation Chart
The statistical analysis conducted on geographies consisting of 497,613,414 people shows a strong positive correlation between the proportion of Sub-Saharan Africans and poverty level among boys under the age of 16 in the United States with a correlation coefficient (R) of 0.745 and weighted average of 20.0%. Similarly, the statistical analysis conducted on geographies consisting of 91,574,378 people shows a weak positive correlation between the proportion of Osage and poverty level among boys under the age of 16 in the United States with a correlation coefficient (R) of 0.221 and weighted average of 17.7%, a difference of 12.8%.
Child Poverty Among Boys Under 16 Correlation Summary
| Measurement | Subsaharan African | Osage |
| Minimum | 6.5% | 7.4% |
| Maximum | 100.0% | 54.5% |
| Range | 93.5% | 47.2% |
| Mean | 30.6% | 23.2% |
| Median | 21.9% | 19.3% |
| Interquartile 25% (IQ1) | 19.4% | 13.1% |
| Interquartile 75% (IQ3) | 34.6% | 31.9% |
| Interquartile Range (IQR) | 15.2% | 18.8% |
| Standard Deviation (Sample) | 21.0% | 12.8% |
| Standard Deviation (Population) | 20.8% | 12.7% |
Similar Demographics by Child Poverty Among Boys Under 16
Demographics Similar to Sub-Saharan Africans by Child Poverty Among Boys Under 16
In terms of child poverty among boys under 16, the demographic groups most similar to Sub-Saharan Africans are Immigrants from Barbados (20.0%, a difference of 0.10%), Immigrants from West Indies (20.0%, a difference of 0.12%), Jamaican (20.0%, a difference of 0.17%), Bangladeshi (20.0%, a difference of 0.25%), and Immigrants from Bangladesh (19.9%, a difference of 0.29%).
| Demographics | Rating | Rank | Child Poverty Among Boys Under 16 |
| Immigrants | Cabo Verde | 0.1 /100 | #269 | Tragic 19.7% |
| Cherokee | 0.1 /100 | #270 | Tragic 19.7% |
| Chickasaw | 0.1 /100 | #271 | Tragic 19.8% |
| Immigrants | Ecuador | 0.1 /100 | #272 | Tragic 19.8% |
| Belizeans | 0.1 /100 | #273 | Tragic 19.9% |
| Immigrants | Bangladesh | 0.0 /100 | #274 | Tragic 19.9% |
| Jamaicans | 0.0 /100 | #275 | Tragic 20.0% |
| Sub-Saharan Africans | 0.0 /100 | #276 | Tragic 20.0% |
| Immigrants | Barbados | 0.0 /100 | #277 | Tragic 20.0% |
| Immigrants | West Indies | 0.0 /100 | #278 | Tragic 20.0% |
| Bangladeshis | 0.0 /100 | #279 | Tragic 20.0% |
| Central Americans | 0.0 /100 | #280 | Tragic 20.1% |
| Immigrants | Zaire | 0.0 /100 | #281 | Tragic 20.1% |
| Comanche | 0.0 /100 | #282 | Tragic 20.1% |
| Immigrants | Jamaica | 0.0 /100 | #283 | Tragic 20.1% |
Demographics Similar to Osage by Child Poverty Among Boys Under 16
In terms of child poverty among boys under 16, the demographic groups most similar to Osage are Panamanian (17.7%, a difference of 0.070%), Immigrants from Eastern Africa (17.7%, a difference of 0.080%), Moroccan (17.7%, a difference of 0.090%), Japanese (17.7%, a difference of 0.12%), and Iraqi (17.7%, a difference of 0.14%).
| Demographics | Rating | Rank | Child Poverty Among Boys Under 16 |
| Malaysians | 7.6 /100 | #208 | Tragic 17.6% |
| Alaskan Athabascans | 7.3 /100 | #209 | Tragic 17.6% |
| Immigrants | Armenia | 6.8 /100 | #210 | Tragic 17.6% |
| Immigrants | Immigrants | 6.7 /100 | #211 | Tragic 17.6% |
| Aleuts | 6.6 /100 | #212 | Tragic 17.7% |
| Immigrants | Eastern Africa | 6.0 /100 | #213 | Tragic 17.7% |
| Panamanians | 5.9 /100 | #214 | Tragic 17.7% |
| Osage | 5.8 /100 | #215 | Tragic 17.7% |
| Moroccans | 5.6 /100 | #216 | Tragic 17.7% |
| Japanese | 5.5 /100 | #217 | Tragic 17.7% |
| Iraqis | 5.5 /100 | #218 | Tragic 17.7% |
| Sierra Leoneans | 5.3 /100 | #219 | Tragic 17.8% |
| Immigrants | Cambodia | 5.1 /100 | #220 | Tragic 17.8% |
| Immigrants | Panama | 4.3 /100 | #221 | Tragic 17.9% |
| Pennsylvania Germans | 3.9 /100 | #222 | Tragic 17.9% |