Samoan vs Dutch West Indian Disability Age 65 to 74
COMPARE
Samoan
Dutch West Indian
Disability Age 65 to 74
Disability Age 65 to 74 Comparison
Samoans
Dutch West Indians
25.4%
DISABILITY AGE 65 TO 74
0.2/ 100
METRIC RATING
262nd/ 347
METRIC RANK
29.6%
DISABILITY AGE 65 TO 74
0.0/ 100
METRIC RATING
325th/ 347
METRIC RANK
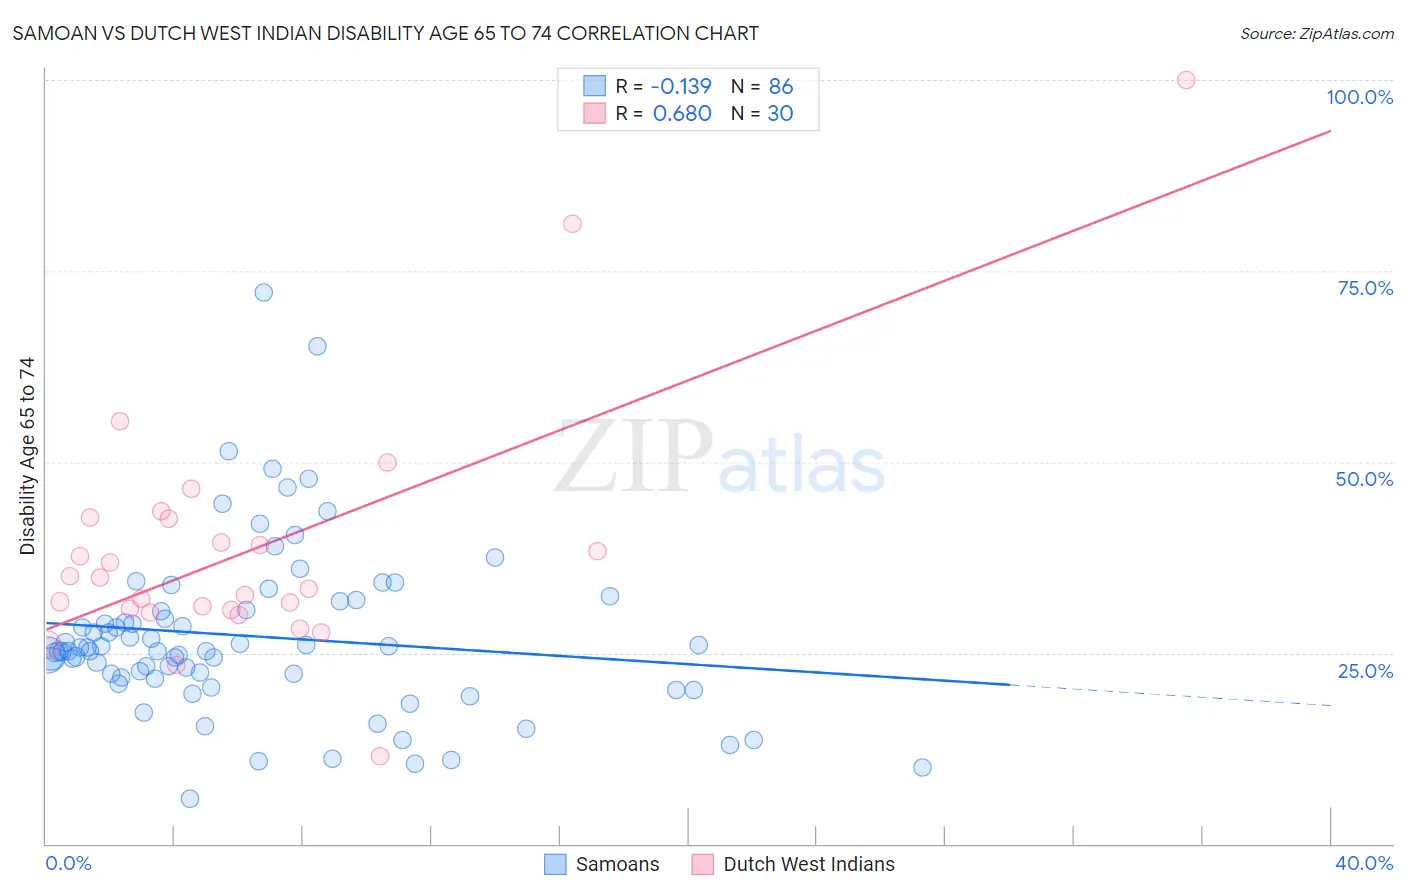
Samoan vs Dutch West Indian Disability Age 65 to 74 Correlation Chart
The statistical analysis conducted on geographies consisting of 224,691,566 people shows a poor negative correlation between the proportion of Samoans and percentage of population with a disability between the ages 65 and 75 in the United States with a correlation coefficient (R) of -0.139 and weighted average of 25.4%. Similarly, the statistical analysis conducted on geographies consisting of 85,748,630 people shows a significant positive correlation between the proportion of Dutch West Indians and percentage of population with a disability between the ages 65 and 75 in the United States with a correlation coefficient (R) of 0.680 and weighted average of 29.6%, a difference of 16.2%.
Disability Age 65 to 74 Correlation Summary
| Measurement | Samoan | Dutch West Indian |
| Minimum | 5.9% | 11.5% |
| Maximum | 72.2% | 100.0% |
| Range | 66.4% | 88.5% |
| Mean | 27.2% | 38.5% |
| Median | 25.3% | 34.1% |
| Interquartile 25% (IQ1) | 21.8% | 30.5% |
| Interquartile 75% (IQ3) | 30.7% | 42.5% |
| Interquartile Range (IQR) | 8.9% | 12.0% |
| Standard Deviation (Sample) | 11.1% | 16.6% |
| Standard Deviation (Population) | 11.1% | 16.4% |
Similar Demographics by Disability Age 65 to 74
Demographics Similar to Samoans by Disability Age 65 to 74
In terms of disability age 65 to 74, the demographic groups most similar to Samoans are Iroquois (25.4%, a difference of 0.010%), Cape Verdean (25.4%, a difference of 0.10%), Malaysian (25.4%, a difference of 0.18%), Hawaiian (25.5%, a difference of 0.35%), and Guatemalan (25.5%, a difference of 0.40%).
| Demographics | Rating | Rank | Disability Age 65 to 74 |
| Central Americans | 0.5 /100 | #255 | Tragic 25.1% |
| Immigrants | Somalia | 0.4 /100 | #256 | Tragic 25.2% |
| Guamanians/Chamorros | 0.3 /100 | #257 | Tragic 25.3% |
| Marshallese | 0.3 /100 | #258 | Tragic 25.3% |
| Immigrants | Cambodia | 0.3 /100 | #259 | Tragic 25.3% |
| Malaysians | 0.2 /100 | #260 | Tragic 25.4% |
| Cape Verdeans | 0.2 /100 | #261 | Tragic 25.4% |
| Samoans | 0.2 /100 | #262 | Tragic 25.4% |
| Iroquois | 0.2 /100 | #263 | Tragic 25.4% |
| Hawaiians | 0.2 /100 | #264 | Tragic 25.5% |
| Guatemalans | 0.2 /100 | #265 | Tragic 25.5% |
| Immigrants | Latin America | 0.1 /100 | #266 | Tragic 25.6% |
| Ottawa | 0.1 /100 | #267 | Tragic 25.6% |
| Liberians | 0.1 /100 | #268 | Tragic 25.6% |
| Hmong | 0.1 /100 | #269 | Tragic 25.7% |
Demographics Similar to Dutch West Indians by Disability Age 65 to 74
In terms of disability age 65 to 74, the demographic groups most similar to Dutch West Indians are Yakama (29.6%, a difference of 0.23%), Apache (29.7%, a difference of 0.38%), Seminole (29.4%, a difference of 0.45%), Hopi (30.0%, a difference of 1.3%), and Puerto Rican (29.1%, a difference of 1.4%).
| Demographics | Rating | Rank | Disability Age 65 to 74 |
| Nepalese | 0.0 /100 | #318 | Tragic 28.0% |
| Arapaho | 0.0 /100 | #319 | Tragic 28.1% |
| Cherokee | 0.0 /100 | #320 | Tragic 28.2% |
| Comanche | 0.0 /100 | #321 | Tragic 28.3% |
| Aleuts | 0.0 /100 | #322 | Tragic 28.4% |
| Puerto Ricans | 0.0 /100 | #323 | Tragic 29.1% |
| Seminole | 0.0 /100 | #324 | Tragic 29.4% |
| Dutch West Indians | 0.0 /100 | #325 | Tragic 29.6% |
| Yakama | 0.0 /100 | #326 | Tragic 29.6% |
| Apache | 0.0 /100 | #327 | Tragic 29.7% |
| Hopi | 0.0 /100 | #328 | Tragic 30.0% |
| Choctaw | 0.0 /100 | #329 | Tragic 30.2% |
| Creek | 0.0 /100 | #330 | Tragic 30.2% |
| Chickasaw | 0.0 /100 | #331 | Tragic 30.2% |
| Natives/Alaskans | 0.0 /100 | #332 | Tragic 30.4% |