Immigrants from West Indies vs Dutch West Indian Disability Age 65 to 74
COMPARE
Immigrants from West Indies
Dutch West Indian
Disability Age 65 to 74
Disability Age 65 to 74 Comparison
Immigrants from West Indies
Dutch West Indians
23.9%
DISABILITY AGE 65 TO 74
15.9/ 100
METRIC RATING
211th/ 347
METRIC RANK
29.6%
DISABILITY AGE 65 TO 74
0.0/ 100
METRIC RATING
325th/ 347
METRIC RANK
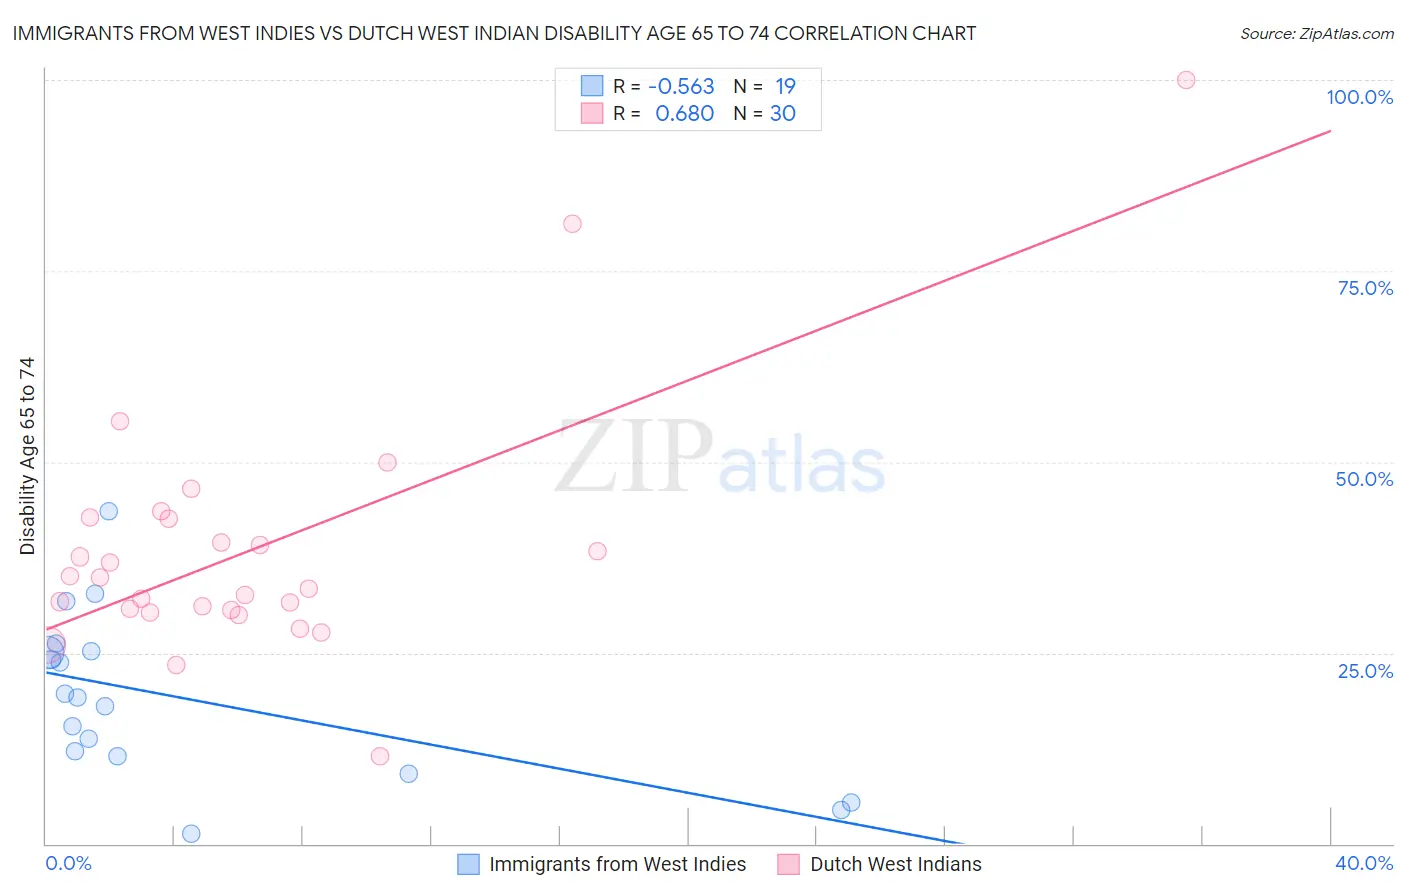
Immigrants from West Indies vs Dutch West Indian Disability Age 65 to 74 Correlation Chart
The statistical analysis conducted on geographies consisting of 72,453,318 people shows a substantial negative correlation between the proportion of Immigrants from West Indies and percentage of population with a disability between the ages 65 and 75 in the United States with a correlation coefficient (R) of -0.563 and weighted average of 23.9%. Similarly, the statistical analysis conducted on geographies consisting of 85,748,630 people shows a significant positive correlation between the proportion of Dutch West Indians and percentage of population with a disability between the ages 65 and 75 in the United States with a correlation coefficient (R) of 0.680 and weighted average of 29.6%, a difference of 23.7%.
Disability Age 65 to 74 Correlation Summary
| Measurement | Immigrants from West Indies | Dutch West Indian |
| Minimum | 1.3% | 11.5% |
| Maximum | 43.6% | 100.0% |
| Range | 42.3% | 88.5% |
| Mean | 19.1% | 38.5% |
| Median | 19.1% | 34.1% |
| Interquartile 25% (IQ1) | 11.4% | 30.5% |
| Interquartile 75% (IQ3) | 25.2% | 42.5% |
| Interquartile Range (IQR) | 13.9% | 12.0% |
| Standard Deviation (Sample) | 10.8% | 16.6% |
| Standard Deviation (Population) | 10.5% | 16.4% |
Similar Demographics by Disability Age 65 to 74
Demographics Similar to Immigrants from West Indies by Disability Age 65 to 74
In terms of disability age 65 to 74, the demographic groups most similar to Immigrants from West Indies are French (23.9%, a difference of 0.020%), Trinidadian and Tobagonian (23.9%, a difference of 0.050%), Nicaraguan (23.9%, a difference of 0.19%), Immigrants from Oceania (24.0%, a difference of 0.26%), and Pennsylvania German (24.0%, a difference of 0.31%).
| Demographics | Rating | Rank | Disability Age 65 to 74 |
| Immigrants | Grenada | 22.1 /100 | #204 | Fair 23.8% |
| Tongans | 20.8 /100 | #205 | Fair 23.8% |
| Immigrants | Jamaica | 20.7 /100 | #206 | Fair 23.8% |
| Immigrants | Sudan | 20.1 /100 | #207 | Fair 23.8% |
| Immigrants | Barbados | 19.6 /100 | #208 | Poor 23.8% |
| Immigrants | Kenya | 19.6 /100 | #209 | Poor 23.8% |
| Trinidadians and Tobagonians | 16.4 /100 | #210 | Poor 23.9% |
| Immigrants | West Indies | 15.9 /100 | #211 | Poor 23.9% |
| French | 15.7 /100 | #212 | Poor 23.9% |
| Nicaraguans | 14.3 /100 | #213 | Poor 23.9% |
| Immigrants | Oceania | 13.6 /100 | #214 | Poor 24.0% |
| Pennsylvania Germans | 13.3 /100 | #215 | Poor 24.0% |
| Jamaicans | 12.2 /100 | #216 | Poor 24.0% |
| Immigrants | Portugal | 11.7 /100 | #217 | Poor 24.0% |
| Immigrants | Nigeria | 11.7 /100 | #218 | Poor 24.0% |
Demographics Similar to Dutch West Indians by Disability Age 65 to 74
In terms of disability age 65 to 74, the demographic groups most similar to Dutch West Indians are Yakama (29.6%, a difference of 0.23%), Apache (29.7%, a difference of 0.38%), Seminole (29.4%, a difference of 0.45%), Hopi (30.0%, a difference of 1.3%), and Puerto Rican (29.1%, a difference of 1.4%).
| Demographics | Rating | Rank | Disability Age 65 to 74 |
| Nepalese | 0.0 /100 | #318 | Tragic 28.0% |
| Arapaho | 0.0 /100 | #319 | Tragic 28.1% |
| Cherokee | 0.0 /100 | #320 | Tragic 28.2% |
| Comanche | 0.0 /100 | #321 | Tragic 28.3% |
| Aleuts | 0.0 /100 | #322 | Tragic 28.4% |
| Puerto Ricans | 0.0 /100 | #323 | Tragic 29.1% |
| Seminole | 0.0 /100 | #324 | Tragic 29.4% |
| Dutch West Indians | 0.0 /100 | #325 | Tragic 29.6% |
| Yakama | 0.0 /100 | #326 | Tragic 29.6% |
| Apache | 0.0 /100 | #327 | Tragic 29.7% |
| Hopi | 0.0 /100 | #328 | Tragic 30.0% |
| Choctaw | 0.0 /100 | #329 | Tragic 30.2% |
| Creek | 0.0 /100 | #330 | Tragic 30.2% |
| Chickasaw | 0.0 /100 | #331 | Tragic 30.2% |
| Natives/Alaskans | 0.0 /100 | #332 | Tragic 30.4% |