Navajo vs Dutch West Indian Disability Age 65 to 74
COMPARE
Navajo
Dutch West Indian
Disability Age 65 to 74
Disability Age 65 to 74 Comparison
Navajo
Dutch West Indians
33.3%
DISABILITY AGE 65 TO 74
0.0/ 100
METRIC RATING
343rd/ 347
METRIC RANK
29.6%
DISABILITY AGE 65 TO 74
0.0/ 100
METRIC RATING
325th/ 347
METRIC RANK
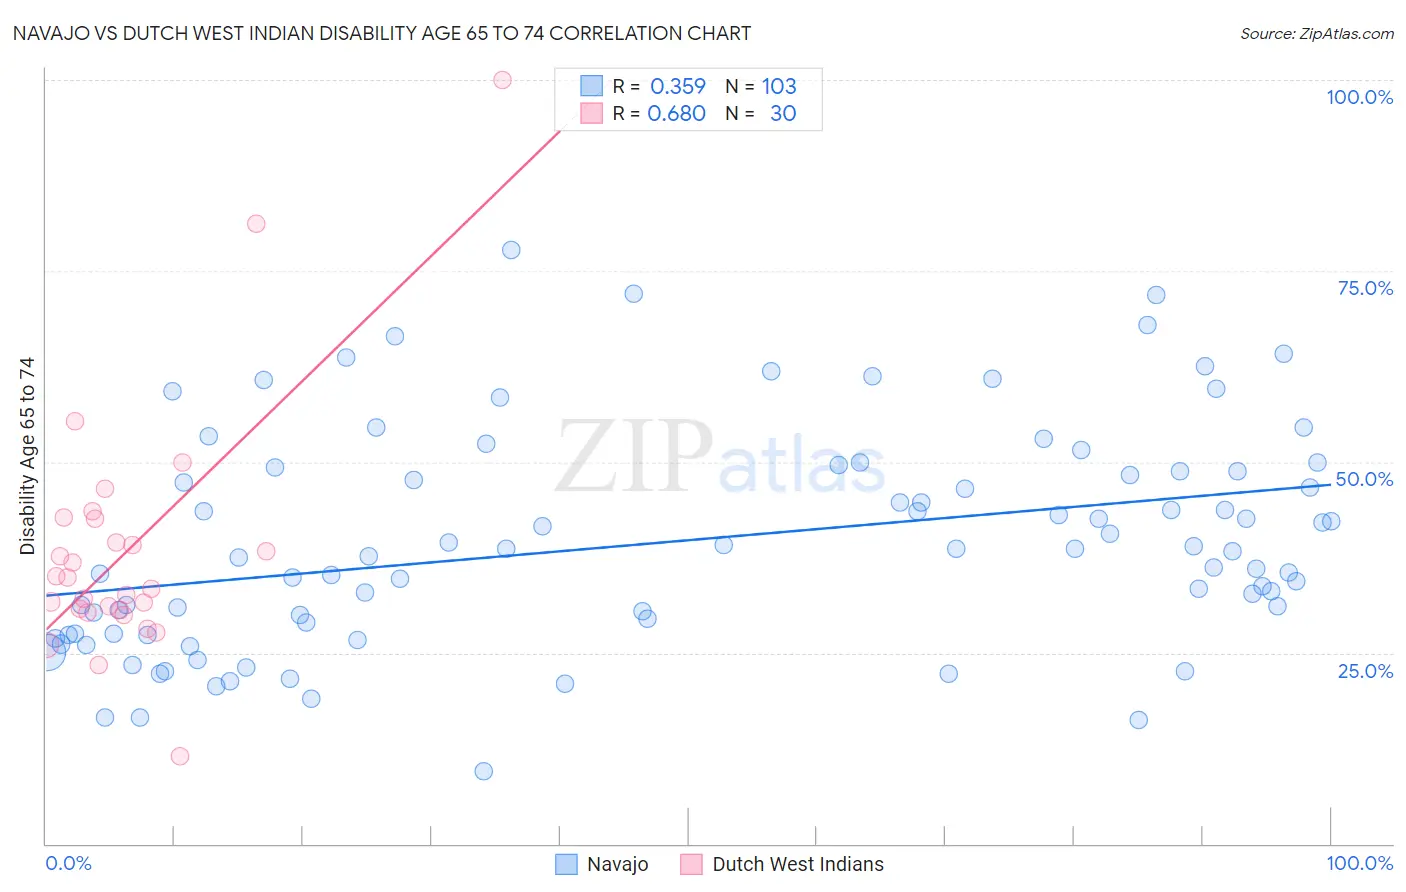
Navajo vs Dutch West Indian Disability Age 65 to 74 Correlation Chart
The statistical analysis conducted on geographies consisting of 224,352,608 people shows a mild positive correlation between the proportion of Navajo and percentage of population with a disability between the ages 65 and 75 in the United States with a correlation coefficient (R) of 0.359 and weighted average of 33.3%. Similarly, the statistical analysis conducted on geographies consisting of 85,748,630 people shows a significant positive correlation between the proportion of Dutch West Indians and percentage of population with a disability between the ages 65 and 75 in the United States with a correlation coefficient (R) of 0.680 and weighted average of 29.6%, a difference of 12.8%.
Disability Age 65 to 74 Correlation Summary
| Measurement | Navajo | Dutch West Indian |
| Minimum | 9.5% | 11.5% |
| Maximum | 77.8% | 100.0% |
| Range | 68.3% | 88.5% |
| Mean | 39.5% | 38.5% |
| Median | 38.2% | 34.1% |
| Interquartile 25% (IQ1) | 27.6% | 30.5% |
| Interquartile 75% (IQ3) | 48.8% | 42.5% |
| Interquartile Range (IQR) | 21.2% | 12.0% |
| Standard Deviation (Sample) | 14.4% | 16.6% |
| Standard Deviation (Population) | 14.3% | 16.4% |
Demographics Similar to Navajo and Dutch West Indians by Disability Age 65 to 74
In terms of disability age 65 to 74, the demographic groups most similar to Navajo are Pueblo (33.1%, a difference of 0.72%), Tsimshian (32.9%, a difference of 1.3%), Lumbee (32.7%, a difference of 1.9%), Kiowa (32.6%, a difference of 2.4%), and Alaskan Athabascan (32.4%, a difference of 3.0%). Similarly, the demographic groups most similar to Dutch West Indians are Yakama (29.6%, a difference of 0.23%), Apache (29.7%, a difference of 0.38%), Seminole (29.4%, a difference of 0.45%), Hopi (30.0%, a difference of 1.3%), and Choctaw (30.2%, a difference of 2.1%).
| Demographics | Rating | Rank | Disability Age 65 to 74 |
| Seminole | 0.0 /100 | #324 | Tragic 29.4% |
| Dutch West Indians | 0.0 /100 | #325 | Tragic 29.6% |
| Yakama | 0.0 /100 | #326 | Tragic 29.6% |
| Apache | 0.0 /100 | #327 | Tragic 29.7% |
| Hopi | 0.0 /100 | #328 | Tragic 30.0% |
| Choctaw | 0.0 /100 | #329 | Tragic 30.2% |
| Creek | 0.0 /100 | #330 | Tragic 30.2% |
| Chickasaw | 0.0 /100 | #331 | Tragic 30.2% |
| Natives/Alaskans | 0.0 /100 | #332 | Tragic 30.4% |
| Colville | 0.0 /100 | #333 | Tragic 30.5% |
| Alaska Natives | 0.0 /100 | #334 | Tragic 30.6% |
| Cheyenne | 0.0 /100 | #335 | Tragic 31.1% |
| Yuman | 0.0 /100 | #336 | Tragic 31.5% |
| Houma | 0.0 /100 | #337 | Tragic 32.3% |
| Alaskan Athabascans | 0.0 /100 | #338 | Tragic 32.4% |
| Kiowa | 0.0 /100 | #339 | Tragic 32.6% |
| Lumbee | 0.0 /100 | #340 | Tragic 32.7% |
| Tsimshian | 0.0 /100 | #341 | Tragic 32.9% |
| Pueblo | 0.0 /100 | #342 | Tragic 33.1% |
| Navajo | 0.0 /100 | #343 | Tragic 33.3% |
| Inupiat | 0.0 /100 | #344 | Tragic 34.5% |