Immigrants from Albania vs Polish Disability Age Over 75
COMPARE
Immigrants from Albania
Polish
Disability Age Over 75
Disability Age Over 75 Comparison
Immigrants from Albania
Poles
46.6%
DISABILITY AGE OVER 75
93.2/ 100
METRIC RATING
122nd/ 347
METRIC RANK
45.3%
DISABILITY AGE OVER 75
99.9/ 100
METRIC RATING
24th/ 347
METRIC RANK
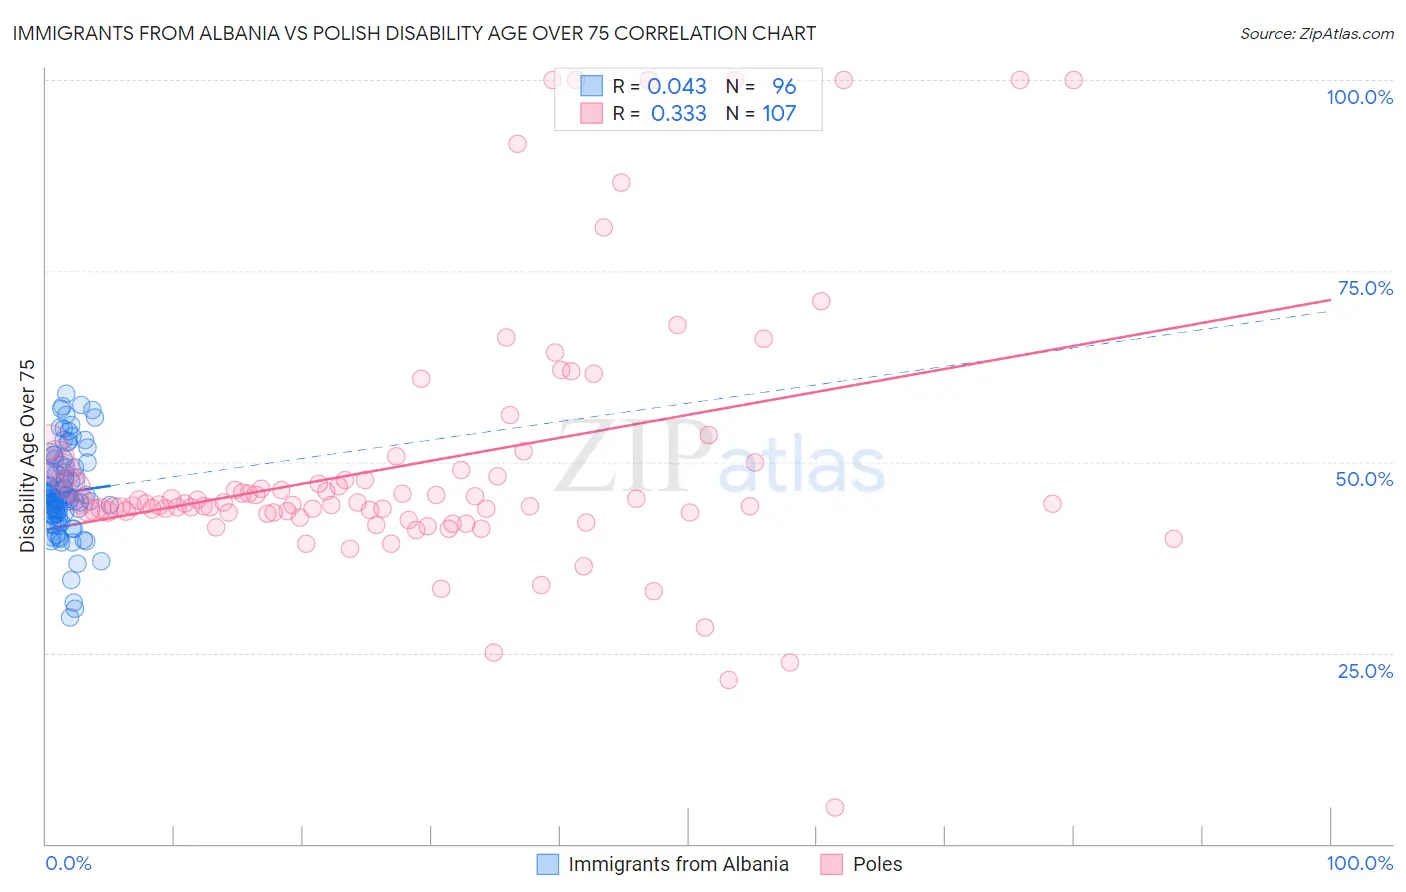
Immigrants from Albania vs Polish Disability Age Over 75 Correlation Chart
The statistical analysis conducted on geographies consisting of 119,350,943 people shows no correlation between the proportion of Immigrants from Albania and percentage of population with a disability over the age of 75 in the United States with a correlation coefficient (R) of 0.043 and weighted average of 46.6%. Similarly, the statistical analysis conducted on geographies consisting of 558,502,134 people shows a mild positive correlation between the proportion of Poles and percentage of population with a disability over the age of 75 in the United States with a correlation coefficient (R) of 0.333 and weighted average of 45.3%, a difference of 2.9%.
Disability Age Over 75 Correlation Summary
| Measurement | Immigrants from Albania | Polish |
| Minimum | 29.7% | 4.8% |
| Maximum | 58.9% | 100.0% |
| Range | 29.2% | 95.2% |
| Mean | 46.0% | 49.8% |
| Median | 45.6% | 44.5% |
| Interquartile 25% (IQ1) | 43.1% | 43.4% |
| Interquartile 75% (IQ3) | 49.5% | 48.9% |
| Interquartile Range (IQR) | 6.3% | 5.5% |
| Standard Deviation (Sample) | 5.8% | 17.4% |
| Standard Deviation (Population) | 5.8% | 17.3% |
Similar Demographics by Disability Age Over 75
Demographics Similar to Immigrants from Albania by Disability Age Over 75
In terms of disability age over 75, the demographic groups most similar to Immigrants from Albania are Scandinavian (46.6%, a difference of 0.050%), Immigrants from Colombia (46.7%, a difference of 0.050%), Immigrants from Nepal (46.6%, a difference of 0.090%), Immigrants from South America (46.7%, a difference of 0.11%), and Canadian (46.6%, a difference of 0.12%).
| Demographics | Rating | Rank | Disability Age Over 75 |
| British | 95.7 /100 | #115 | Exceptional 46.5% |
| Indians (Asian) | 95.7 /100 | #116 | Exceptional 46.5% |
| Hungarians | 95.3 /100 | #117 | Exceptional 46.5% |
| Czechoslovakians | 94.7 /100 | #118 | Exceptional 46.6% |
| Canadians | 94.4 /100 | #119 | Exceptional 46.6% |
| Immigrants | Nepal | 94.1 /100 | #120 | Exceptional 46.6% |
| Scandinavians | 93.6 /100 | #121 | Exceptional 46.6% |
| Immigrants | Albania | 93.2 /100 | #122 | Exceptional 46.6% |
| Immigrants | Colombia | 92.6 /100 | #123 | Exceptional 46.7% |
| Immigrants | South America | 91.8 /100 | #124 | Exceptional 46.7% |
| Colombians | 91.3 /100 | #125 | Exceptional 46.7% |
| Europeans | 91.2 /100 | #126 | Exceptional 46.7% |
| Syrians | 91.1 /100 | #127 | Exceptional 46.7% |
| Icelanders | 90.9 /100 | #128 | Exceptional 46.7% |
| Immigrants | Germany | 90.8 /100 | #129 | Exceptional 46.7% |
Demographics Similar to Poles by Disability Age Over 75
In terms of disability age over 75, the demographic groups most similar to Poles are Immigrants from Switzerland (45.3%, a difference of 0.020%), Immigrants from Bolivia (45.4%, a difference of 0.040%), Immigrants from South Africa (45.3%, a difference of 0.050%), Immigrants from Belgium (45.3%, a difference of 0.080%), and Macedonian (45.4%, a difference of 0.080%).
| Demographics | Rating | Rank | Disability Age Over 75 |
| Immigrants | India | 100.0 /100 | #17 | Exceptional 45.2% |
| Bolivians | 100.0 /100 | #18 | Exceptional 45.2% |
| Immigrants | Greece | 100.0 /100 | #19 | Exceptional 45.2% |
| Immigrants | Serbia | 100.0 /100 | #20 | Exceptional 45.3% |
| Immigrants | Belgium | 100.0 /100 | #21 | Exceptional 45.3% |
| Immigrants | South Africa | 100.0 /100 | #22 | Exceptional 45.3% |
| Immigrants | Switzerland | 99.9 /100 | #23 | Exceptional 45.3% |
| Poles | 99.9 /100 | #24 | Exceptional 45.3% |
| Immigrants | Bolivia | 99.9 /100 | #25 | Exceptional 45.4% |
| Macedonians | 99.9 /100 | #26 | Exceptional 45.4% |
| Immigrants | Poland | 99.9 /100 | #27 | Exceptional 45.4% |
| Thais | 99.9 /100 | #28 | Exceptional 45.4% |
| Filipinos | 99.9 /100 | #29 | Exceptional 45.4% |
| Immigrants | Denmark | 99.9 /100 | #30 | Exceptional 45.4% |
| Immigrants | Bulgaria | 99.9 /100 | #31 | Exceptional 45.5% |