Japanese vs Czechoslovakian Disability Age Over 75
COMPARE
Japanese
Czechoslovakian
Disability Age Over 75
Disability Age Over 75 Comparison
Japanese
Czechoslovakians
50.2%
DISABILITY AGE OVER 75
0.0/ 100
METRIC RATING
303rd/ 347
METRIC RANK
46.6%
DISABILITY AGE OVER 75
94.7/ 100
METRIC RATING
118th/ 347
METRIC RANK
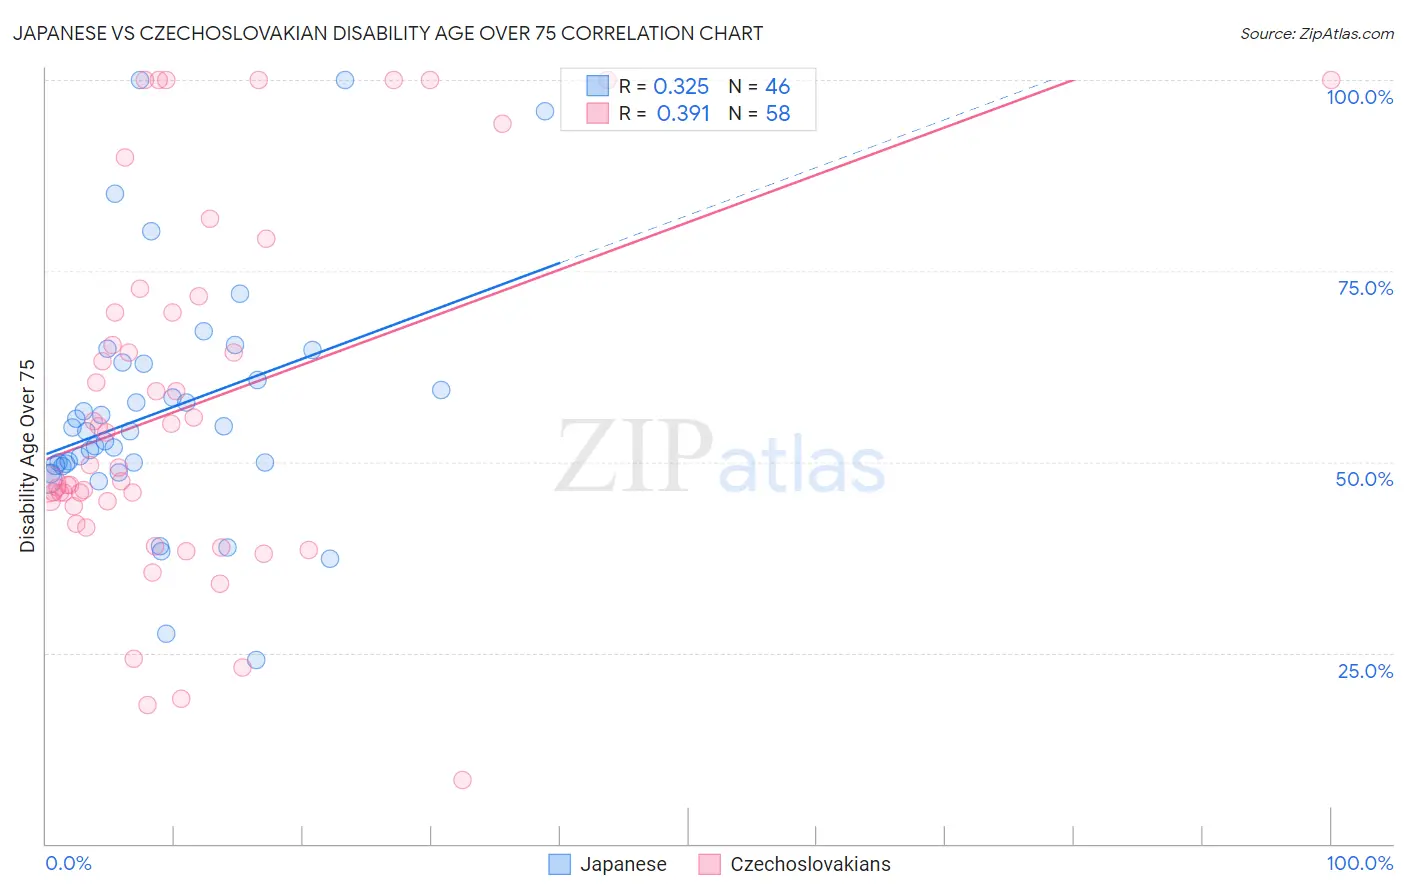
Japanese vs Czechoslovakian Disability Age Over 75 Correlation Chart
The statistical analysis conducted on geographies consisting of 248,861,887 people shows a mild positive correlation between the proportion of Japanese and percentage of population with a disability over the age of 75 in the United States with a correlation coefficient (R) of 0.325 and weighted average of 50.2%. Similarly, the statistical analysis conducted on geographies consisting of 368,266,748 people shows a mild positive correlation between the proportion of Czechoslovakians and percentage of population with a disability over the age of 75 in the United States with a correlation coefficient (R) of 0.391 and weighted average of 46.6%, a difference of 7.9%.
Disability Age Over 75 Correlation Summary
| Measurement | Japanese | Czechoslovakian |
| Minimum | 24.0% | 8.3% |
| Maximum | 100.0% | 100.0% |
| Range | 76.0% | 91.7% |
| Mean | 56.6% | 57.3% |
| Median | 54.0% | 49.4% |
| Interquartile 25% (IQ1) | 49.6% | 44.1% |
| Interquartile 75% (IQ3) | 62.8% | 69.6% |
| Interquartile Range (IQR) | 13.3% | 25.5% |
| Standard Deviation (Sample) | 15.9% | 23.7% |
| Standard Deviation (Population) | 15.7% | 23.5% |
Similar Demographics by Disability Age Over 75
Demographics Similar to Japanese by Disability Age Over 75
In terms of disability age over 75, the demographic groups most similar to Japanese are Cherokee (50.2%, a difference of 0.010%), Immigrants from Dominican Republic (50.3%, a difference of 0.11%), Dominican (50.2%, a difference of 0.17%), Cape Verdean (50.1%, a difference of 0.23%), and Immigrants from Micronesia (50.1%, a difference of 0.26%).
| Demographics | Rating | Rank | Disability Age Over 75 |
| Mexican American Indians | 0.0 /100 | #296 | Tragic 50.0% |
| Armenians | 0.0 /100 | #297 | Tragic 50.0% |
| Marshallese | 0.0 /100 | #298 | Tragic 50.1% |
| Immigrants | Micronesia | 0.0 /100 | #299 | Tragic 50.1% |
| Cape Verdeans | 0.0 /100 | #300 | Tragic 50.1% |
| Dominicans | 0.0 /100 | #301 | Tragic 50.2% |
| Cherokee | 0.0 /100 | #302 | Tragic 50.2% |
| Japanese | 0.0 /100 | #303 | Tragic 50.2% |
| Immigrants | Dominican Republic | 0.0 /100 | #304 | Tragic 50.3% |
| Central American Indians | 0.0 /100 | #305 | Tragic 50.5% |
| Immigrants | Central America | 0.0 /100 | #306 | Tragic 50.5% |
| Immigrants | Fiji | 0.0 /100 | #307 | Tragic 50.6% |
| Hispanics or Latinos | 0.0 /100 | #308 | Tragic 50.6% |
| Aleuts | 0.0 /100 | #309 | Tragic 50.6% |
| Tlingit-Haida | 0.0 /100 | #310 | Tragic 50.6% |
Demographics Similar to Czechoslovakians by Disability Age Over 75
In terms of disability age over 75, the demographic groups most similar to Czechoslovakians are Canadian (46.6%, a difference of 0.030%), Immigrants from Nepal (46.6%, a difference of 0.060%), Hungarian (46.5%, a difference of 0.080%), Scandinavian (46.6%, a difference of 0.10%), and Indian (Asian) (46.5%, a difference of 0.13%).
| Demographics | Rating | Rank | Disability Age Over 75 |
| Immigrants | Chile | 96.4 /100 | #111 | Exceptional 46.5% |
| Immigrants | Pakistan | 96.1 /100 | #112 | Exceptional 46.5% |
| Irish | 96.0 /100 | #113 | Exceptional 46.5% |
| Dutch | 95.9 /100 | #114 | Exceptional 46.5% |
| British | 95.7 /100 | #115 | Exceptional 46.5% |
| Indians (Asian) | 95.7 /100 | #116 | Exceptional 46.5% |
| Hungarians | 95.3 /100 | #117 | Exceptional 46.5% |
| Czechoslovakians | 94.7 /100 | #118 | Exceptional 46.6% |
| Canadians | 94.4 /100 | #119 | Exceptional 46.6% |
| Immigrants | Nepal | 94.1 /100 | #120 | Exceptional 46.6% |
| Scandinavians | 93.6 /100 | #121 | Exceptional 46.6% |
| Immigrants | Albania | 93.2 /100 | #122 | Exceptional 46.6% |
| Immigrants | Colombia | 92.6 /100 | #123 | Exceptional 46.7% |
| Immigrants | South America | 91.8 /100 | #124 | Exceptional 46.7% |
| Colombians | 91.3 /100 | #125 | Exceptional 46.7% |