Black/African American vs Chinese Disability Age 18 to 34
COMPARE
Black/African American
Chinese
Disability Age 18 to 34
Disability Age 18 to 34 Comparison
Blacks/African Americans
Chinese
7.7%
DISABILITY AGE 18 TO 34
0.0/ 100
METRIC RATING
292nd/ 347
METRIC RANK
6.3%
DISABILITY AGE 18 TO 34
91.9/ 100
METRIC RATING
128th/ 347
METRIC RANK
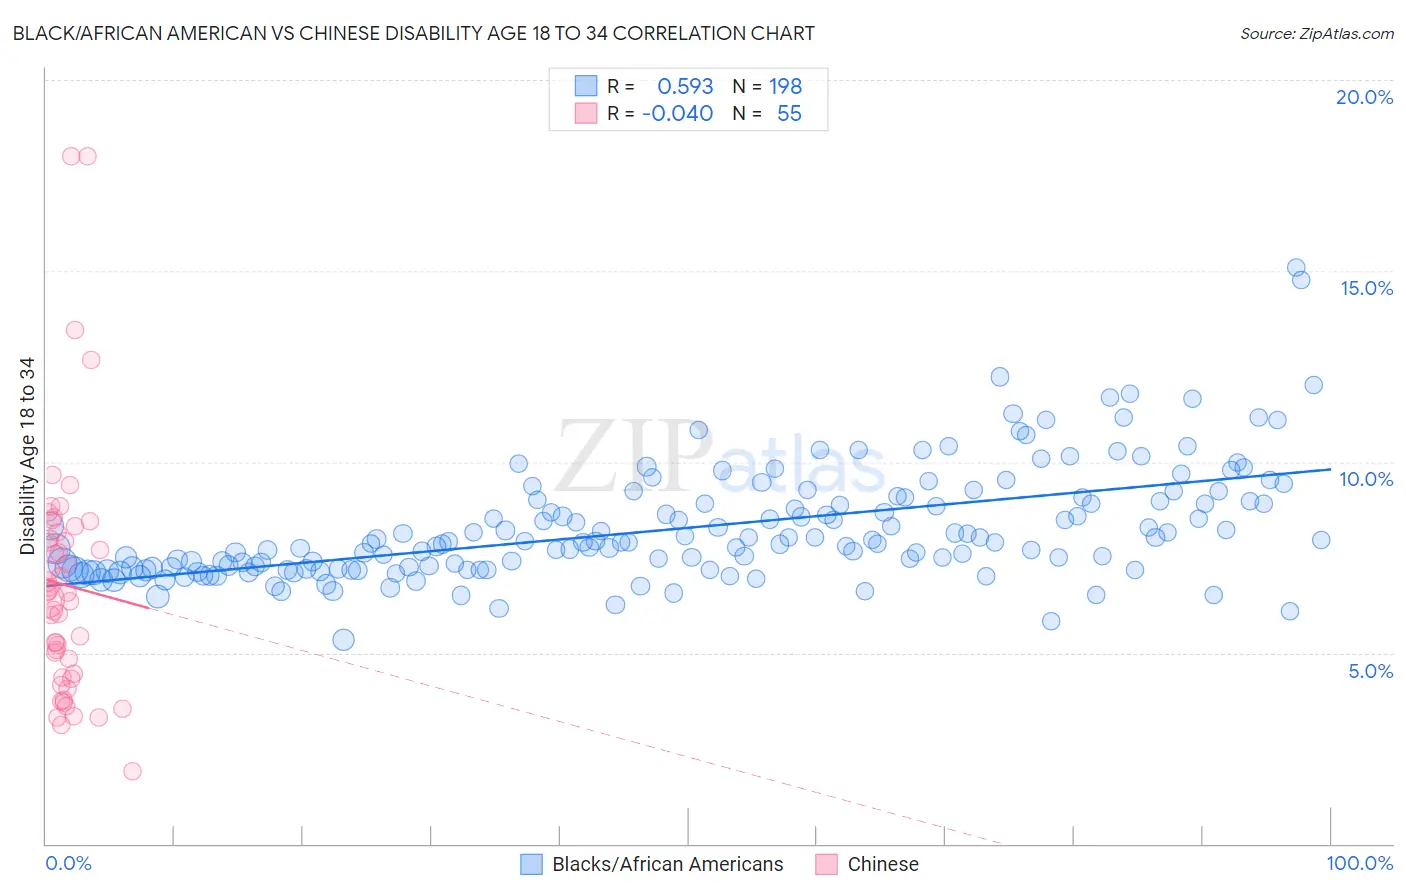
Black/African American vs Chinese Disability Age 18 to 34 Correlation Chart
The statistical analysis conducted on geographies consisting of 561,495,678 people shows a substantial positive correlation between the proportion of Blacks/African Americans and percentage of population with a disability between the ages 18 and 35 in the United States with a correlation coefficient (R) of 0.593 and weighted average of 7.7%. Similarly, the statistical analysis conducted on geographies consisting of 64,771,320 people shows no correlation between the proportion of Chinese and percentage of population with a disability between the ages 18 and 35 in the United States with a correlation coefficient (R) of -0.040 and weighted average of 6.3%, a difference of 21.4%.
Disability Age 18 to 34 Correlation Summary
| Measurement | Black/African American | Chinese |
| Minimum | 5.3% | 1.9% |
| Maximum | 15.1% | 18.0% |
| Range | 9.7% | 16.1% |
| Mean | 8.3% | 6.8% |
| Median | 7.9% | 6.6% |
| Interquartile 25% (IQ1) | 7.2% | 4.4% |
| Interquartile 75% (IQ3) | 9.0% | 8.1% |
| Interquartile Range (IQR) | 1.8% | 3.8% |
| Standard Deviation (Sample) | 1.5% | 3.2% |
| Standard Deviation (Population) | 1.5% | 3.2% |
Similar Demographics by Disability Age 18 to 34
Demographics Similar to Blacks/African Americans by Disability Age 18 to 34
In terms of disability age 18 to 34, the demographic groups most similar to Blacks/African Americans are Scandinavian (7.7%, a difference of 0.060%), Immigrants from Cabo Verde (7.7%, a difference of 0.21%), Irish (7.7%, a difference of 0.22%), Tlingit-Haida (7.7%, a difference of 0.22%), and Slovak (7.7%, a difference of 0.27%).
| Demographics | Rating | Rank | Disability Age 18 to 34 |
| Swedes | 0.0 /100 | #285 | Tragic 7.5% |
| Celtics | 0.0 /100 | #286 | Tragic 7.6% |
| Norwegians | 0.0 /100 | #287 | Tragic 7.6% |
| Whites/Caucasians | 0.0 /100 | #288 | Tragic 7.6% |
| Immigrants | Nonimmigrants | 0.0 /100 | #289 | Tragic 7.6% |
| Slovaks | 0.0 /100 | #290 | Tragic 7.7% |
| Irish | 0.0 /100 | #291 | Tragic 7.7% |
| Blacks/African Americans | 0.0 /100 | #292 | Tragic 7.7% |
| Scandinavians | 0.0 /100 | #293 | Tragic 7.7% |
| Immigrants | Cabo Verde | 0.0 /100 | #294 | Tragic 7.7% |
| Tlingit-Haida | 0.0 /100 | #295 | Tragic 7.7% |
| Cape Verdeans | 0.0 /100 | #296 | Tragic 7.7% |
| Pueblo | 0.0 /100 | #297 | Tragic 7.7% |
| Dutch | 0.0 /100 | #298 | Tragic 7.7% |
| Germans | 0.0 /100 | #299 | Tragic 7.7% |
Demographics Similar to Chinese by Disability Age 18 to 34
In terms of disability age 18 to 34, the demographic groups most similar to Chinese are West Indian (6.3%, a difference of 0.010%), Immigrants from Switzerland (6.3%, a difference of 0.15%), Macedonian (6.3%, a difference of 0.18%), Immigrants from Morocco (6.3%, a difference of 0.24%), and Costa Rican (6.3%, a difference of 0.26%).
| Demographics | Rating | Rank | Disability Age 18 to 34 |
| Immigrants | Guatemala | 93.4 /100 | #121 | Exceptional 6.3% |
| Immigrants | Czechoslovakia | 93.3 /100 | #122 | Exceptional 6.3% |
| Costa Ricans | 92.9 /100 | #123 | Exceptional 6.3% |
| Immigrants | Morocco | 92.9 /100 | #124 | Exceptional 6.3% |
| Macedonians | 92.6 /100 | #125 | Exceptional 6.3% |
| Immigrants | Switzerland | 92.5 /100 | #126 | Exceptional 6.3% |
| West Indians | 92.0 /100 | #127 | Exceptional 6.3% |
| Chinese | 91.9 /100 | #128 | Exceptional 6.3% |
| Immigrants | Italy | 90.5 /100 | #129 | Exceptional 6.3% |
| Immigrants | Dominica | 90.5 /100 | #130 | Exceptional 6.3% |
| Immigrants | Saudi Arabia | 90.4 /100 | #131 | Exceptional 6.3% |
| Guatemalans | 89.6 /100 | #132 | Excellent 6.4% |
| Brazilians | 89.0 /100 | #133 | Excellent 6.4% |
| Immigrants | Europe | 88.8 /100 | #134 | Excellent 6.4% |
| Palestinians | 88.5 /100 | #135 | Excellent 6.4% |